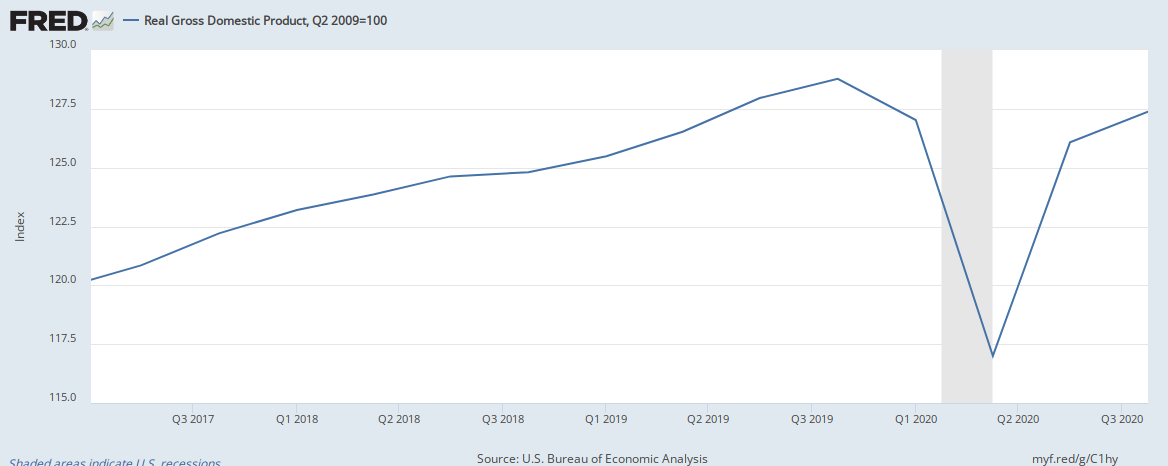
As you can see, GDP had been on a steady upward trajectory until 4Q2019 and then it steadily declined and bottomed out in 2Q2021. Since then the GDP has recovered, but based on 4Q2021 data it is still well below the previous peak. What this tells you, similar to the employment post I shared, is that this recovery is merely regaining the economic activity that was lost. During the Great Recession, GDP bottomed out in 2Q2009 and it did not regain that level until 4Q2010. This time around, if we assume the same increase in the Index value from 3Q2020 to 4Q2020 of 1.2, then we’ll regain the 4Q2019 GDP value by the end of this year. It’s anyone’s guess, but sometime in 2022 may seem a more reasonable expectation.
That being said, the major problem here, thought, is the fact that this “growth” is being finance by the massive government bailouts, which is not a sustainable way to grow GDP. When the effects of fiscal expansion wane, what we may end up having is low growth and inflation (the dreaded stagflation, similar to what we had in the 1970s).


No comments:
Post a Comment