Wednesday, March 31, 2021

The Year of the Crack-up Boom

The Financial Times reported the following today in their article titled, “Boom in blank-cheque deals fuels bumper season for global M&A”:
Global dealmaking had its strongest start to the year in four decades, fuelled by a flurry of US acquisitions and Spac mergers, even as the global economy reels from the impact of lockdowns and coronavirus restrictions.
Deals worth $1.3tn were agreed in the three months to March 30, more than any first quarter since at least 1980 and topping even the heady levels of the dot-com boom at the turn of the millennium, according to Refinitiv.
This time period of Quantitative Easing (a fancy name given to describe money printing) by the Central Bankers, combined with a low interest rate environment, has ignited all kinds of speculative endeavors and giving rise to a perceived economic boom. 
The great economist Ludwig von Mises described this perceived economic boom as a crack-up boom: a period of time where Central Bank intervention by way of interest rates suppression and money printing leads people to making wrong decision in terms of capital/investment allocation. Why? Because the market prices discovery mechanism is distorted by the intervention and leads people to misread these price signals – which end up causing money to go into investments that would not have occurred apart from intervention. This scenario is what has been happening over the last year, and the longer it continues means that economic errors are accumulating. At some point this trend will reverse, and when that happens, we will have the inversion of the crack-up boom: financial ruin! 

Tuesday, March 30, 2021

The Foreseeable End of the Post-World War II Monetary System

The article I am linking today is from Doug Casey. You can find it here. The article is a succinct description of the political economy of the last 70+ years.

After World War II, the US took the leadership position in the world when previously strong European nations were weakened by the prolong war and its destructive aftermath. The US leadership resulted in a new world order that included a revised monetary system where the US Dollar reigned supreme and the values of all remaining currencies were linked to it.

The US Dollar was backed by gold, but in 1971 the US delinked the currency completely from it. Since that time the entire world has been operating under a fiat monetary system, which relies exclusively on the willingness and ability of governments not to spend beyond its means. However, the reality is that governments rarely ever exercise self-control in terms of spending.

And what we have seen since 1971 is an international financial system supported almost entirely by debt. For example, at the moment the total federal debt for US is approximately $27 trillion dollars, which is light years away from where it stood in 1971 (about $390 billion).  At some point, the debt load will become unsustainable, a tipping point will be reached, and an implosion of monumental proportions will occur. This will mark the end of the Post-World War II monetary system and a new one will emerge.        

Monday, March 29, 2021

Government Employees: Another Look at Government Debt

In today’s post I want to compare the growth rate in the number of Government employees to the growth rate in the number of Private employees. To that end, I extracted data from the St. Louis Fed FRED system and then indexed that data to visualize the evolution of their growth rates.

You can go here for the graph, or simply look further below. A few observations stand out:

·         From 1960 to 2014 the growth rate of Government employees exceeded the growth rate of employees in the Private market. You can see that by simply observing the “red” line being above the “blue” line.

·         The growth rate of Government employees seems to have peaked around 2008, and has been essentially flat since that time. But in 2015 until the March 2020 lockdowns, the trajectory of the growth turned upward – albeit very slowly.

·         From 2010 until the March 2020 lockdowns, the growth rate of Private employees began to grow at a faster pace than Government employees.

It is worthwhile to note that the underlying dynamics for each dataset are not the same, so we must be careful not to go beyond the obvious. Government employee data is fairly homogeneous, whereas Private employee data is heterogeneous. In other words, the Government data is an agglomeration of one entity (government); whereas, Private data is an agglomeration of multiple entities (many companies). This means that the risk factors that drive one dataset are different than the other.

What does all this tell us?

·         The growth in Private enterprise has kept pace with the Government.

·         The growth in Government represents the “cost of doing business” because the government does not produce anything of value on its own, but rather redistributes wealth.

·         Government is well-entrenched in the economy, which at the moment makes up about 18% of real GDP (as of 4Q2020).

·         It is no coincidence that as Government employees have grown, so has the Federal Debt. This does not bode well as indicator of whether the debt will be paid down. Federal debt will continue to grow.

Government / Private Employee Growth 


Saturday, March 27, 2021

The Mainstream’s Got It Wrong - BY JAMES RICKARDS

Note: In this article from Mr. Rickards of the Daily Reckoning explains the strong fundamentals for a meaningful rally in gold. I agree with his assessment. The economy is being fictitiously pumped up by a lot of government money, coupled with the fiddling of interest rates by the Federal Reserve is giving an impression of stability. And in this impression, the price of gold has gotten hammered. But as reality sets in and there is recognition that the economic foundation is weak, the price of gold should go up. Why? Because as the massive amounts of liquidity chases few good, consumer inflation will increase at some point.  Always and everywhere, gold performs exceptionally well in times of inflation. But if we suppose that indeed the economy will improve and long-term interest continue their downward trend, then that also means that the price of gold should go up. So, either way, says Mr. Richards, there is reason to be bullish in gold.

*************************

Here is the article in its entirety:

The Mainstream’s Got It Wrong - BY JAMES RICKARDS

Gold has taken a hit this year, no doubt about it. Since peaking over $1,950 in early January, the price of gold has fallen to $1,725 today.

But not all is doom and gloom. Some perspective is needed. If we go back to the beginning of the current bull market on December 16, 2015 (when gold bottomed at $1,050 per ounce), gold is up over 60% even at today’s beaten-down price.

That bottom occurred on the exact day that the Fed started their “lift-off” in interest rates after seven years stuck at zero. I urged investors to buy gold then. Those who listened are still sitting on huge gains even after the latest drawdown.

Savvy investors know the dollar price of gold is volatile. They keep their eye on the long-term trends and long-term drivers of the gold price. Sophisticated investors don’t sweat the dips. They see the occasional drawdowns as a great entry point and buying opportunity. So do I.

Nothing New Here

We’ve been here before.

Gold fell 17% from August 5, 2016, to December 1, 2016. It fell 8.1% from September 8, 2017, to December 13, 2017. It fell 12.5% from March 6, 2020, to March 19, 2020, during the pandemic panic.

After every one of these falls, gold rallied back and maintained a trend line of higher highs, finally reaching the $2,000 per ounce threshold in August 2020.

The important questions for gold investors are: Is this just a dip or the start of a new bear market?

And, what’s been driving the dip; when can we expect a turnaround? We address both questions by looking at the mainstream scenario and explaining why it’s wrong and how the turnaround will emerge.

The Mainstream Scenario

Here’s the mainstream scenario: The U.S. and global economies are making a strong comeback from the pandemic. China is growing quickly, U.S. unemployment is dropping, the virus is fading and the lockdowns are ending. This would be a recipe for strong growth and higher interest rates by itself.

Now, Congress and the White House have passed a $1.9 trillion COVID relief bill, which has little to do with COVID and everything to do with spending for favored interests, including teachers, municipal workers, federal workers, and community organizers. It also provides money for programs such as the Kennedy Center, the National Endowment for the Arts, etc.

The market view is that this additional $1.9 trillion of spending, combined with the $6 trillion of deficit spending already approved for fiscal 2020 and fiscal 2021 and another $4 trillion deficit spending package expected later this year, is more than the COVID situation requires and more than the economy can absorb without inflation.

Therefore inflation expectations have risen sharply. And, along with inflation expectations, the yield-to-maturity on the benchmark 10-year U.S. Treasury note has spiked.

The yield on the 10-year has risen from 0.917% on January 4 to 1.316% on February 6 to 1.638% today. Those rate hikes might not sound like much, but it’s an earthquake in the note market.

If you compare the rate hikes to the decline in gold prices, there is a high degree of correlation. As rates go up, gold goes down. It’s that simple.

More deficit spending stokes the flames of inflation expectations, which leads to higher rates and lower gold prices. When those fundamental trends are combined with leverage, algo-trading, and momentum, it’s like throwing gasoline on an open flame.

Gold investors have been getting burned.

What’s flawed in this scenario? The short answer: everything.

Perspective

You can’t argue with the facts – rates are going up, and gold is going down. But, the assumptions behind these trends are flawed. That means the trends will inevitably reverse, probably sharply.

Again, perspective helps.

This is not our first interest rate spike. The 10-year note hit 3.96% on April 2, 2010. It then fell to 2.41% by October 2, 2010. It spiked again to 3.75% on February 8, 2011, before falling sharply to 1.49% on July 24, 2012.

It spiked again, hitting 3.22% on November 2, 2018, before plummeting to 0.56% on August 3, 2020, one of the greatest rallies in note prices ever.

There’s a pattern in this time series called “lower highs and lower lows.” The highs were 3.96%, 3.75% and 3.22%. The lows were 2.41%, 1.49%, and 0.56%.

The point is that the note market does back up from time-to-time. And when it does, it cannot hold the prior rate highs and eventually sinks to new rate lows.

If we apply that pattern to the current rise in rates, we should expect that the rate increase will top out well short of 2.5%, and a new low may follow as low as 0.25% or even zero. There’s no guarantee of this; it’s not deterministic. But, it would be consistent with the 10-year trend of lowering rates.

Still, there’s more going on. The economy is not nearly as strong as the headlines and Wall Street cheerleaders would have you believe.

The Alternative Scenario

Unemployment rates are coming down not because of strong job creation, but because able-bodied, prime-age workers are dropping out of the workforce. The decline in the labor force participation rate is behind the lower unemployment rate because the drop-out workers are not counted as “unemployed.”

If they were, the real unemployment rate would be about 11%, a rate associated with depressions.

Retail sales are being pumped-up by Treasury checks handed out by Congress. What happens when those checks stop?

Real estate losses are being held down by rent moratoriums and anti-eviction decrees. What happens when the rent is finally due?

Student loan defaults are on hold because a grace period on repayment has been extended. What happens when the grace period is over?

The real story is that the economy is weak, but the weakness is being papered-over by handouts, grace periods and repayment standstills. When those handouts stop, growth will slow sharply, and deflation or disinflation will reappear.

Higher interest rates are anticipating inflation, but the inflation is a mirage. Gas at the pump and housing prices are going up. Almost everything else from tuition to healthcare to clothing is going down.

Gold Wins Either Way

What comes next? The realization that we’re not re-inflating will take time to sink in. It will emerge from the data over the next six months.

Congress will halt multi-trillion deficit spending packages, despite the wishful thinking of Democrats that the country is ready for another trillion-dollar package. By mid-to-late 2021, the music will stop, the economy will slow, interest rates will resume their long-term downtrend and gold prices will soar.

What if I’m wrong? That would be good news for gold also.

The worst situation for gold is the one we have now where rates are going up, but there’s no actual inflation. If I’m right about inflation, then rates will come back down, and gold will rally.

But, if inflation actually does appear, guess what? Gold will go up because it always does in inflation.

Gold wins either way.

Junk For Sale: Purchasing a Ticket for Disaster

In a bubble economy many metrics that would otherwise be measures of concern end up becoming the norm – until reality sets in. One of these metrics is the issuance of junk bonds. Junk bonds represent bonds issued by companies that are at high risk of defaulting when compared to the bonds issued by well-established companies.

According to Financial Times:
“Companies have issued $140bn in the US junk bond market over the past three months, outpacing a record dash for cash in the second quarter of 2020 when groups raced for funding to survive the shock of coronavirus…The three biggest issuance quarters on record have all fallen in the past 12 months, helping to propel the size of the US high yield market towards a record $1.5tn, according to data from Ice Data Services, from $1.2tn at the start of last year.”
When we look in particular at the historical view of the US High Yield market we see that yields are at a record low (see graph below). This means that as demand for bonds goes up, the yields go down; and when yields go down, the market price of these bonds goes up. The demand for these junk bonds is mainly being driven by the FRB’s low interest rates policy, which is incentivizing investors to flood to market that generate a return above holding cash. The current rate yield of 4.45% is significantly above keeping cash at practically zero at the bank. The risk in holding these junk bonds is that, as can be observed in the graph, yields shoot up fairly quick when sentiments turn sour, which will inevitably lead to a collapse in value for these bonds. If the 2008-2009 period is of any indication, then expect to see yields in the 20-30% range, at a minimum, when the economic bubble finally pops; and when that happens, the junk bonds will live up to their name.


Friday, March 26, 2021

Best Performing Asset Class

This graph below from Chart of the Day illustrates the total return by asset class from 2010-2020 and YTD 2021. The returns are adjusted for inflation. It is no surprise that Equities have been the best performing asset out of the bunch. In an environment that systemic risk has been minimized, or so it seems, by FRB’s loose monetary policy, one would expect the best performing assets to be where the risk/reward is high. However, the opposite is also true: when sentiment becomes bearish, expect equities to fall the hardest.


Wednesday, March 24, 2021

Money Multiplier: An Updated Look

I have noted previously about how last month the FRB updated its measure of M1, whereby they are now including savings accounts into the equation. Prior to May 2020 savings accounts were excluded from the M1 measure due to the withdrawal restrictions that these accounts had. The inclusion of savings accounts had the effect of increasing the amount of M1. As a result of this change, I have updated the money multiplier proxy that I shared in a previous post.

As you can see from the graph below, there is a drastic jump in May 2020 that reflects the inclusion of savings accounts. What is also obvious is that the money multiplier has somewhat flatten over the last several months. It is difficult to forecast what the future holds, but the amount of liquidity injected in the markets has been so massive that even the slight decline in the money multiplier should not have a meaningful impact in the short-term as to how markets move. In our case, the overall trend is what matters. Nevertheless, as the multiplier decreases, the rate of multiplication is slowing, which means that prices are likely to rise at a slower pace; or in some instances, like the stock market, a correction is likely in the cards if the trend continues. Bear in mind that this metric has a month lag, so at this moment it may not be reflective of the current environment – particularly after the $1.9 trillion fiscal stimulus recently passed by the Biden Administration.

Money Multiplier: April 2018 - February 2021


Tuesday, March 23, 2021

How to Lie with Statistics – Part 2: The Well-Chosen Average

Continuing with my previous post, here I summarize Chapter 2 of the book How to Lie with Statistics. This chapter is titled, The Well-Chosen Average.

The key thought in this chapter is to remember to ask more questions when you hear or read about some “average”, such as the “average” income, the “average” pay, or “average” price – just to name a few. The first thing to remember is to ask, what kind of average and how that metric is calculated. An arithmetic average, which you simply divide a total amount by the number of observations, will yield a different outcome compared with the median average, which gives you the middle amount after sorting the data in ascending or descending order.

When averages are particularly highlighted, that should alert us to be on the lookout that a deceptive figure may be coming our way. If you are not told exactly how he average is calculated, do not readily accept the conclusions being submitted.

Any dataset that is skewed, that is, when graphed you see that the data particularly bunched in one side, the relevant “average” is the median. The arithmetic average will always be deceptive in such skewed data. So, be aware, be alert when you come across the “average” something.

Monday, March 22, 2021

The Federal Reserve Is Wasting Tons of Money - by Bill Bonner

Note: Courtesy of Bill Bonner. The original article can be found here.

**************************

“Go too far. Stay too long. Can’t get back.”

– Words of an old preacher

YOUGHAL, IRELAND – The bond market is on the move.

It packed up in August of last year, which now appears to have marked the top of the bull market in bonds that began 41 years ago.

And last week, Treasury yields (which rise and fall inversely with bond prices) topped 1.75% after Federal Reserve chief Jerome Powell let it be known that he was okay with rising inflation threats.

One-point-seventy-five percent doesn’t sound like much. It’s not… still barely zero in real terms. (Consumer prices are rising at a 0.4% rate.)

But it’s more than three times what it was last August.

Cash is on the move, too. Last Thursday, $271 billion of it bolted from the feds’ vaults, mostly to fund the stimmy checks. That was more than the entire GDP of Finland.

Has the Fed already gone too far and stayed too long? Now, with rising rates in the bond market, and an almost infinite demand for new cash, can it ever get back?

Trillion-Dollar Wonders

Just to remind readers, “inflation” refers to the act of increasing the money supply.

And just to be even clearer, while there are many factors that come into play, as the quantity of dollars increases, eventually… sooner or later… before Hell freezes over… ceteris paribus – so should prices.

The money supply – using the Fed’s balance sheet as a convenient, though incomplete, measure – rose from under $700 billion in 1999 to $7 trillion today.

That is, in two decades, the Fed inflated the money supply by 10 times as much as all the Treasury secretaries and Fed governors had done in the previous 21 decades.

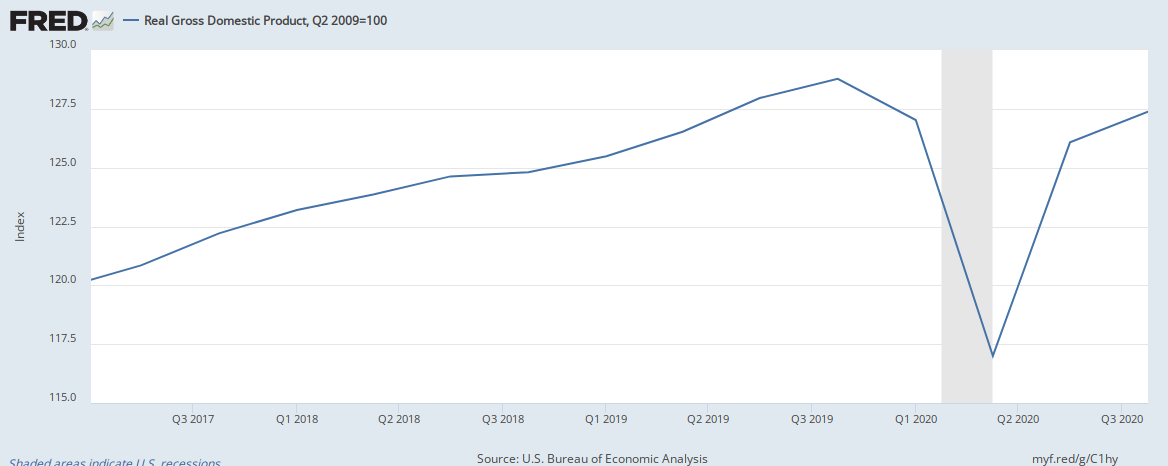
Meanwhile, the goods and services available to buy with this money, measured loosely by GDP, only doubled, from $10 trillion to over $20 trillion.

The idea behind the post-1971 “monetarist” scheme was that the Fed would control money growth, allowing it to rise by about the same measure as the general economy. This was supposed to maintain price stability as well as eliminate sudden credit shortages.

But as you can see, so far in the 21st century, the money supply grew nine times faster than GDP.

And now it will have to grow even more – to replace the cash that just got away. And more after that… to pay for the $1.9 trillion American Rescue Plan… and more still… to pay for new infrastructure… and all the other wonders that the feds have in store for us.

So, we shouldn’t be too surprised that prices rose, too.

Money bids for goods and services. If the quantity of money goes up faster than the supply of available goods and services… logically, prices will rise.

Waste of Money

To this bare skeleton, we add some fat.

Included in GDP is government spending. But the services offered by the government are not the kind that you are usually looking for.

Few people wake up in the morning and say, “Today, I’m going shopping for an F-35 Joint Strike Fighter.” Instead, they want the things the government doesn’t make.

Government spending is almost completely focused on the consumption of wealth, not the creation of it. In other words, it doesn’t add to the supply side of the supply/demand teeter totter. It subtracts from it.

So, when government spending increases as a percentage of GDP, that too should be cause for higher consumer prices.

After WWII, total government spending – state, local, and federal – shrank to a bit more than 25% of GDP. Last year, it was over 40%.

Flood of Liquidity

Economists describe inflation as more and more dollars “chasing” consumer goods. But dollars are not always ready to run.

Sometimes, people choose to save, rather than spend. And if the feds create a dollar and it goes nowhere, it has little effect on prices.

Where it decides to go matters, too. Most of the additional money generated in the 21st century was dropped off in the capital markets.

The Dow rose from around 11,000 in 2000 to over 30,000 today.

Bitcoin was worth nothing (it wasn’t invented until 2008) and now sells for more than $57,000.

Non-Fungible Tokens (NFTs) didn’t appear until 2014. Since then, more than half a billion dollars’ worth of NFTs have been traded.

Don’t Fight the Fed

A flood of liquidity lifted most boats… but not all of them. Some 40% of U.S. stocks are still underwater from the washout of ’08-’09.

As the feds pumped more and more liquidity (dollars) into the markets, the old timers – with their Graham and Dodd on their desks… and an autographed photo of Warren Buffett on their walls – were unsuited to it.

They knew how gold provided protection from inflation, but they weren’t sure about bitcoin. Was it a protection against inflation… or just a measure of it? And NFTs? What the heck were they? Where were they going?

Nobody knew for sure… but they were on the move.

But then, just about everything is on the move now – the bond market… the way we work… gender… politics… culture…

…but to where?

Wall Street legend Marty Zweig’s famous line – “don’t fight the Fed” – turned out to be the best advice of the last 20 years.

The Fed was inflating. And like plastic bottles on a sour tide, up popped the lightest – and often the trashiest – assets.

What will happen in the next decade is our subject for tomorrow.

Will the old-timers get another chance? Will the Fed keep inflating, even as bonds go down? Or will it be able to get back to a more “normal” monetary policy?

We will see. Stay tuned…

Regards,

signature

Bill

Saturday, March 20, 2021

High Demand for European Debt: An Elevator to Hell

I have written previously about the European Union’s debt load. It is massive. Yet, the demand from investors to obtain a piece of the action has been quite impressive. The same can be said about the European Central Bank (ECB).  Here is what the FT reported:
“Spain attracted more than €130bn of orders for a 10-year syndication in January, the second record deal in 12 months. In February, an Italian 10-year sale drew €108bn in orders, breaking a record set last summer. Former bailout recipient Greece has also drawn a crowd with new 30-year debt — its first since the financial crisis.”
And this is what the FT said about the ECB’s actions:
"Private-sector demand for eurozone government debt is backed by a vast bond-buying programme from the European Central Bank, which is seeking to shore up financial conditions and an economy hobbled by the shock of coronavirus. Since last March, the central bank’s emergency Covid-19 bond-buying programme has absorbed more than €760bn in public sector debt, buying after it is issued in the secondary market."
This is both an implicit and explicit support of debt markets by the ECB. In the old days this would be called “debt monetization”, which is the action of the Government issuing debt and then immediately after the Central Bank buying it with printed money. The expected result would be inflation. But now we are told that no such thing can happen. However, it would be unwise to accept that belief because, in the words of Milton Friedman, inflation always and everywhere is a monetary phenomenon. 

Bid-to-cover ratio
This ratio gives you a sense of demand. It is defined as the ratio of the number of bids received in a government debt auction compared to the number of accepted bids. As you can see, the demand has been quite robust.


How to Lie with Statistics – Part 1: The Sample with the Built-in Bias

In times of confusion I have a general principle that I often apply: go back to basics! In other words, when things may appear complex, gibberish, or outright confusing, you should still be able to filter down key pieces of information in such a way that will allow almost any individual with some curiosity to discern the quality of the results. All you need are some simple tools. A hammer goes a long way to hammering nails, as opposed to using a piece of rock. So, it is with the intent of passing along some useful tools that I write the following book summary from the classic How to Lie with Statistics by Darrell Huff. This is a fantastic little book that gives insight as to the tricks used by many people (particularly those who have an agenda) in order to fit the data to their conclusions. Beware of such people.

I will write a short summary of each chapter and then posted it here periodically. Here is Chapter 1.

The Sample with the Built-in Bias

When we want to get a sense of a general trend in some population, we normally select a sample from that population. That sample must be representative of the whole. When it is not, then any metric we calculate will be an aberration, an illusion, or an incorrect figure. A key metric, or more commonly referred to as an statistic, is the “average”: the “average” person, the “average” temperature, the “average” employee, etc. Be on the alert when you come across such phrase because the proverbial “average” may be ripe with all sorts of bias – some of which is seen and some of which is unseen.

As I mentioned, a sample is supposed to be representative of the population. When it is not and we subsequently extrapolate conclusions based on the sample metric, we will draw all sorts of wrong implications. And by extrapolation I mean that you take some metric and apply conclusions beyond the boundaries that the metric allows you. For example, let us say a prestigious business school publishes the “average” salaries obtained from respondents who submitted surveys. The likely outcome is that a very handsome salary will be the average and thus published to the public. But consider the following as relates to this survey: self-respondents may tend to exaggerate, or those not choosing to report might do so because of their low salaries and not wanting to be perceived as failures. In our example, if these two factors are not disclosed or accounted for, you might as well disregard the “average” salary metric as bogus. 

Precision of a metrics is also a red flag: for example, when you read/hear that an “average” family has “2.05” children, or that someone on average takes “7.85” showers a week, etc. Such number is so precise that it frankly renders is meaningless. There are many things in life that are nearly impossible to measure with such precision.  

Thursday, March 18, 2021

Special Purpose Acquisition Companies: A Disaster in the Making

In an age where massive liquidity injections are causing all sort of market distortions, some peculiar activities often take place, which at the moment they may not look aberrant. It is only in hindsight that we have 20/20 vision. For example, prior to the financial crisis of 2008-2009, I recall that some hedge funds were going public. If we think about it, the main value that a hedge fund brings is that it has a greater ability when compared to other portfolio managers to generate extra returns. This extra return is what’s called the “alpha” in the investment vernacular. If investing in a passive market Index simply generates some sort of return, then when you beat the market – that extra return – you are said to generate alpha. In plain English, alpha is your value.  When hedge funds began to go public around 2006, effectively they were selling the alpha that no longer existed. They were cashing in on perceived value, not real value.

So I take notice when I come across articles, such as this one from the FT, that calls attention to special purpose acquisition companies (SPACs) and mentions that YTD 2021 has outdone 2020 in money flowing to these entities. In particular it says that:  

Spacs have raised $79.4bn globally since the start of the year, eclipsing the $79.3bn that flooded into vehicles in 2020, according to data provider Refinitiv, as of Tuesday night. So far in 2021, 264 new Spacs have been launched, overtaking last year’s record 256.

In an economy that has been juiced by massive monetary and fiscal policies over the last year, coupled with the economic disruptions from the lockdowns, the available companies that indeed generate value are rare. Money printing does not generate sustainable economic growth. What many of these SPACs are doing is simply funding bad investment that at some point will lose significant value, if not outright default. Why would a company want to sell itself to a SPAC when they know that they truly generate value? It is not rational for a business person to do that: a handful? Maybe; but a bunch? No! Of course, if a business is barely holding on because of government bailouts, then you can rest assure that many of those are the first in line to be sold to a SPAC.

SPAC Proceeds


Wednesday, March 17, 2021

Some Thoughts on Daniel Kahneman’s Book Thinking, Fast and Slow

It is a worthwhile experiment to periodically check ourselves to assure that we are thinking properly about a matter of interest to us. This is the proverbial introspection, a sort of kicking the tires and tightening the nuts and bolts of our mind. As a man thinks, so he is…or so a Biblical proverb says. It is this perspective that stimulated my thinking when I came across Daniel Kahneman's book titled Thinking, Fast and Slow (TFS). 
For those who don't know Mr. Kahneman, he is an eminent scholar who has influenced many in the behavioral finance field. His writings have explored the realm of rational behavior of people in the course of living life, and what he has found is often at odds with the rational being that makes up many economic/finance models. Some of his conclusions are quite eye-opening, such that all of us need to take heed, lest we become culprits of our own downfall. 
TFS points out how our mind is bifurcated in the way it processes information: on the one hand, a part of our mind takes in information without doing much thinking; while the other half takes a more rigorous analytical approach to reach conclusions. Which part of the mind we are using depends on the nature of the activity we are undertaking. A somewhat easy task, like brushing your teeth, will take less effort when compared to, say, studying chemistry. Often unaware, we shift from the latter to the former way of thinking and therefore end up making gross errors. 
This becomes problematic when we don't take into account for the fact that we have certain behavioral limitations, aka biases or heuristic, that we must be aware of and to ensure we have rules not to fall into that trap. 
Here I will point out a few of the behavioral limitations, as noted in TFS:
1. Anchoring - here is when we reach a conclusion that was based on recent piece of information that may or may not have been connected to the subject of the inquiry. For example, if I were to say 20, and then ask how many islands are there in the Caribbean, your answer will likely revolve around 20. 
2. Regression to the mean - here we are saying that performance tends to average out over time. So, any above or below average observation can be expected to regress to its average. 
3. Narrative Fallacy has to do with the fact that we prefer simple and plain explanations, as opposed to complex or theoretical propositions.
4. Hindsight bias has to do with looking back at experiences and re-interpreting them to fit our understanding of current information. This typically comes out as, “I knew this was going to happen.” But the reality is that “knowing” now occurred because we have re-interpreted our understanding.
5. Loss averse tells us that we dislike losing more than the gaining of some amount. For example, if we were to measure this, we'd say the person dislikes more losing $100 than winning $150.
6. Endowment effect has to do with the idea that we attribute more value to something simply because we own it (or used to own it).
All of us are prone to these biases, which is a good enough reason to be careful to readily accept "expert" opinion, particularly in complex fields (where standard errors are high, to put it in statistical terms). Examples are many when we look at fields that relate to forecasting events. Being able to discern the expert’s ability, whether it was their talent or skill or just imply pure chance or luck, is a task we must engage. 

Tuesday, March 16, 2021

The Vaccines Aren’t Actually Vaccines - BY JAMES RICKARDS

Note: Courtesy of Daily Reckoning's James Rickards article on a topic that is pertinent these days: vaccines.

******************

The Vaccines Aren’t Actually Vaccines

 - BY JAMES RICKARDS

Is the world on the brink of a fourth wave of increasing coronavirus infections and deaths?

Based on the latest data, that’s a possibility that cannot be ruled out right now. Here’s why…

After the virus broke out in Wuhan, China, it spread rapidly to Milan, Italy, where a new strain called the Italian Strain became much more contagious. The Italian Strain spread through Europe and then to New York and surrounding states. This was the first wave that lasted through March and April 2020.

There was a reduction of new caseloads in May and June before a second wave began in July. The second wave receded in September and leveled off in October 2020. The third wave exploded in November 2020 and peaked on January 8, 2021.

At its worst, the third wave showed an increase in daily cases that was nine times the first wave and daily fatalities that were double the first wave. Since January 8, both the caseload and fatalities have trailed off sharply.

Today, the increases in new cases and fatalities are about where they were at the height of the second wave, but down sharply from the height of the third wave.

The combination of declining caseloads, expanding vaccinations and simple herd immunity has given many people hope that the spread of the virus can be contained, if not completely eliminated, by this summer and that life can begin to get back to something like normal.

“Mutation Escape”

However, there’s no assurance of that. There are concerns that a new fourth wave may be emerging. There are many reasons this could be the case.

Even as vaccine programs expand, the virus continues to mutate in ways designed to decrease the efficacy of the vaccine, something called “mutation escape.”

At the same time, many individuals are not taking the vaccines because they are concerned that the vaccine’s experimental genetic modification therapy could have possible, unforeseen side effects (see below). And, some regions do not have ready access to the vaccines, regardless of their efficacy.

It would be great to finally put the pandemic behind us, but it may be too soon to declare victory. Each wave lasts about eight weeks, so if a new wave emerges now, it may result in increased caseloads and fatalities at least until June.

Let’s hope the fears of a fourth wave are a false alarm. Still, investors need to keep an eye on this possibility before sounding the all clear.

Many economists are projecting a strong rebound as more Americans are vaccinated against COVID-19. But the vaccines themselves raise some potentially serious problems…

No Serious Medical Consequences?

A recent article in The Hill argues, “… the barriers to a return to normal remain in the form of vaccine hesitancy, as millions voice skepticism over shots that have shown no serious medical consequences.”

Well, it’s not entirely true that these vaccines have shown no serious medical consequences.

A few people have died, and others have developed severe side effects immediately after receiving the Astra Zeneca COVID-19 vaccine (which isn’t being used in the U.S). As a result, Austria has suspended the use of the AstraZeneca vaccine while investigations are underway.

Meanwhile, an otherwise healthy 39-year old Utah woman recently died four days after taking her second shot of the Moderna vaccine. Her liver stopped functioning, according to doctors.

To be clear, side effects and even death are not unusual among those receiving vaccines. Most people don’t have serious problems, but no approach is 100% perfect. Pharmaceutical companies and clinicians try to minimize such events in the development and testing of vaccines.

Public health policy is based on balancing potential harm from the vaccine against the benefits of the vaccine in terms of lives saved. This information should be provided to patients so they can make an informed consent.

he risks may be low, but they do exist and a small number of people may experience serious side effects or even death.

But, here’s what’s not widely known (and is available from drug manufacturers’ own clinical tests of the vaccines)…

The Vaccines Aren’t Really Vaccines

First, these so-called vaccines are not really vaccines in the widely understood sense.

A traditional vaccine involves an injection either with a weakened form of the virus you are protecting against or a similar virus. Either one can produce antibodies that remain in the system and fight the actual disease if you get it.

These new vaccines are entirely different.

I don’t want to get too deep into the weeds here, but these treatments use experimental genetic modification to inject you with mRNA, which is a partial strand of genetic code.

That mRNA then enters your cells and orders the cells to construct a spike protein similar to SARS-CoV-2 (the virus that causes COVID). This spike protein then precipitates antibodies that can reduce your reaction to SARS-CoV-2 if you get it.

But the “vaccine” does not prevent you from getting COVID, and it does not prevent you from spreading it to others.

The spike protein remains with you indefinitely. In effect, you have modified your own genetic make-up to fight COVID without actually gaining immunity and without reducing transmissibility.

According to the U.S. Centers for Disease Control and Prevention, if you’re immune to a disease, “you can be exposed to it without becoming infected.”

But these vaccines do not prevent you from being infected or spreading it to others. Some have likened them to chemotherapy for a cancer you don’t have.

Brave New World

Vaccines of this type with respect to viruses are entirely new in humans. Studies have not gone on long enough to evaluate long-term side effects. These drugs are not FDA approved; they are being distributed under an emergency waiver to avoid the normal approval process. It’s almost like we’re being used as guinea pigs.

It is likely that most people receiving the drugs are unaware of these important differences between the new drugs and traditional vaccines, which raises questions about whether their “consent” is fully informed.

There could be very good reasons for vulnerable individuals to take these drugs, but they should not be mistaken for the kind of smallpox, polio and flu vaccinations with which we are familiar.

As far as vaccines go, mRNA genetic therapy is a brave new world — one that is not well understood.

Monday, March 15, 2021

GDP + Government Debt = Stagnant + Inflation

This graph of the real gross domestic product (GDP) is a good picture of the damaged caused by the 2020 government lockdowns. The “real” GDP takes into account the impact of inflation. The logic being that a dollar in some previous year is worth more than that same dollar today. The way that inflation is taken into account is by taking some base year (for example, 2012) and recalculating the gross domestic product value to adjust for the inflation rate. I’ve also taken liberty to further adjust the graph and created an index value to get a sense of the general trend of GDP.


As you can see, GDP had been on a steady upward trajectory until 4Q2019 and then it steadily declined and bottomed out in 2Q2021. Since then the GDP has recovered, but based on 4Q2021 data it is still well below the previous peak. What this tells you, similar to the employment post I shared, is that this recovery is merely regaining the economic activity that was lost. During the Great Recession, GDP bottomed out in 2Q2009 and it did not regain that level until 4Q2010. This time around, if we assume the same increase in the Index value from 3Q2020 to 4Q2020 of 1.2, then we’ll regain the 4Q2019 GDP value by the end of this year. It’s anyone’s guess, but sometime in 2022 may seem a more reasonable expectation.   
That being said, the major problem here, thought, is the fact that this “growth” is being finance by the massive government bailouts, which is not a sustainable way to grow GDP. When the effects of fiscal expansion wane, what we may end up having is low growth and inflation (the dreaded stagflation, similar to what we had in the 1970s).

Saturday, March 13, 2021

How to Read a Bloomberg Article

Note: This is an article that was published on March 9, 2021 in Bloomberg. I share it here with my comments in bold and in brakets [] to help you see how financial media pushes wrong information.
    
*************************
There's a popular story that goes like this: In the wake of the Great Financial Crisis, the Fed did all this ultra-loose monetary policy and money printing, and this cash went straight into speculative assets -- fueling a massive boom in things like tech startups, FANGs, Uber, WeWork and Airbnb. However the story is wrong mechanically, theoretically and empirically. If anything, what drove the tech boom was overly tight monetary and fiscal policies.
[“Popular story” is a way to say, “you all got fooled, but I didn’t”.]

To start, let's talk mechanics for just one second. By now you've heard that when the Fed "prints money" there's no new cash actually entering the economy. QE is an asset swap. Reserves are created, but Treasuries are pulled out of the market and brought onto the Fed's balance sheet. The net wealth position of the private sector is unchanged. So right off the bat, there's no new money brought into existence that could rain down upon Silicon Valley. The mechanics of money creation don't work like that.

[This paragraph is inaccurate. Yes, Central Bank Reserves are printed and exchanged for Treasuries via Primary Dealers. That’s standard Central Bank so-called ‘open market operations’. But the exchange is not equal. When reserves enter the economy via the banking system they magically multiply because we have a fractional reserve banking system, whereby a portion of reserves are kept on hand and the rest is lent out. Private bank after private bank repeats this process until more money than the initial injection is created.]  

It is true, to be fair, that monetary stimulus can contribute to positive risk appetite. And risk appetite can help catalyze investment into speculative assets.

[These two sentences effectively confirm the “popular story” he intends to refute in the first paragraph.]

But speculative inclination to invest is a complicated thing and there's no one policy that can just make it happen. So the link between investment and the Fed isn't 100% non-existent. However it works nothing like the popular "printed money goes into Adam Neumann's pocket" narrative that's become conventional wisdom.

[Here again the writer acknowledges that the Fed’s policy has some connection to speculative inclinations to invest, although at the moment he has not yet committed or stated what that connection is or how much is the impact. We are left to wonder.]

What's clear now though is that this boom in tech, which has lasted longer than a decade, has been fueled by tight money, rather than loose money. First of all, how can we establish that money has, in fact, been tight? It turns out that basically any analytical framework you use will tell you that. For one thing, inflation has been mild and below target for years and years.

[Here is a typical approach of financial writers, they fail to define terms. Which inflation is he referring? What are the numbers that support this statement? Again, we are left to wonder.]

Furthermore unemployment has been elevated, and persistently below potential.

[Similar comment as above: no numbers provided to support that statement. Also, “potential” is a fancy way for economist to guess what should be the true employment level, which no one knows for sure. The most problematic thing here is the confusion: he says that unemployment is below potential. That is a good thing. We want unemployment to be as low as possible. What Mr. Weisenthal meant to say is that employment is below potential.]

Meanwhile, rates at the long end of the curve have been extremely low over the last decade. What's that? Long end rates mean policy has been tight? Is this some weird MMT thing?

[Here the writer comes somewhat clean by stating that his definition of tight monetary policy is that long-term rates have been extremely low over the last decade. Although he does not mention it, it appears that he’s referring to UST; but again, he does not mention what specific points in the Treasury Yield Curve he’s referencing. Is the 10-, 20-, 30-year? We don’t know. But let us test the accuracy of this statement. Let’s pick the 30-year Treasury from ten years ago, let’s say, from March 1, 2011 which at that time it was 4.48%; in March 1, 2013 it was 3.06%; in March 2, 2015 it was at 2.68%; in March 1, 2017 it was at 3.06%; in March 1, 2019 it was at 3.13%; and in March 1, 2021 it was at 2.23%. So, yes, in comparison to today, rates have been low. But rates have been low in comparison to today across the entire tenor of the curve.]

Here's Milton Friedman in 1997 in the Wall Street Journal:

Initially, higher monetary growth would reduce short-term interest rates even further. However, as the economy revives, interest rates would start to rise. That is the standard pattern and explains why it is so misleading to judge monetary policy by interest rates. Low interest rates are generally a sign that money has been tight, as in Japan; high interest rates, that money has been easy.

[That specific quote from Friedman is problematic. First, no mention is made as to what the Central Bank will do when the economy revives. Will the Bank continue to generate “higher monetary growth”? He doesn’t say. Mr. Friedman also says that it’s “misleading to judge monetary policy by interest rates,” yet that is exactly what he is doing. You cannot have it both ways.]

My emphasis added. Given low inflation, poor employment and low long-end interest rates, it's clear that policy has been tight, not loose, by basically anyone's analytical framework. And it's these tight conditions that have fueled the Silicon Valley boom. It's not complicated. When growth is scarce throughout the economy, it stands to reason that investors will pay more for companies that BYOG (Bring Your Own Growth), which aren't dependent on GDP. And so you get your high valuations on software and FANGs and Teslas and Ubers. In fact that last one, Uber, represents a business model that was specifically built for a tight money period, when labor was abundant, but capital was scarce. In fact many of the hottest gig economy, delivery-type startups have been predicated on abundant, cheap labor. The exact opposite of overheating.

[Like a salesman in desperation to sell something, Mr. Weisenthal is mixed up. Low inflation? Yet, as I said before, no one has a clue which “inflation” metric he is talking about. Poor employment? Yet, just prior to the Pandemic the US economy had historically low unemployment rates.  He says that “labor was abundant, but capital was scarce”, but again, no proof of that is given.]

This above characterization of the interplay between monetary policy and tech isn't theoretical. In D.C. right now we're finally getting a real policy pivot. It's all systems go on the fiscal expansion. And the Fed is now committed to not raising rates until we get back to full employment, committing to letting inflation run warm. And now we're getting those higher long-end rates -- remember the Milton Friedman quote -- policy is loosening. And it's in this new policy stance that speculative tech has been getting hammered and underperforming badly (see ARKK, QQQ, SPAK etc.). With policymakers pulling out all the stops to boost GDP, there just isn't much reason to pay out the nose for growth anymore. Growth is not a scarce asset.

[Here he just said that “now we’re getting those higher long-end rates”. Compare to what? In a previous paragraph that “extremely low over the last decade”. Anyone with their thinking cap on would not take this article serious.]

If you've spent any time following Silicon Valley people on Twitter over the last year, you'll notice more and more of them sound like goldbugs, posting charts of the M2 Money Supply or the Fed Balance Sheet, or talking about inflation or the Chapwood Index to warn about the dangers of Fed largesse. And at first I thought this was just about them shilling cryptocurrencies and establishing a narrative around their Ethereum and Bitcoin bags. And that's a big part of it. But it's also increasingly clear that a truly hot economy removes Silicon Valley's monopoly on growth and the fat valuations that come along with it. So of course, many of them don't want the Fed and Congress to really let it rip.

[With a few ad hominem and straw-man arguments, he ends his article that in his mind has proved his flimsy theory. You would be wise to learn to spot this nonsense and pay no mind to it, if only to learn how not to think like Mr. Weinsenthal.]