[Blogger's Note: A timely commentary by Financial Times analyst, Gillian Tett regarding the swaps market anomaly that recently arose; namely, swap rates trading below treasury rates in the 10-year tenor bucket. It is certainly worth the read. I share her comments.]
********************************************************
By Gillian Tett
Published: March 29 2010 (Financial Times)
In recent years, a key axiom that every investment manager learnt at school (or, more accurately, in an MBA class) was that the rate at which triple A-rated countries such as America could borrow money could be labelled the “risk-free” rate – and corporate (and) other borrowing costs could be measured against it.
But is it time to rethink that “risk-free” tag? If you look at what is happening in the US and UK interest rate markets right now, the answer is “yes”. From time immemorial, it has been taken as self-evident that the swaps spread in debt markets should be “positive”. What this so-called “swaps spread” essentially measures is the cost of borrowing funds in the Libor market (for a private companies, such as banks), minus the cost of raising government debt.
And, since the private borrowing costs are influenced by credit and counterparty issues (ie: whether banks default or fail to repay), logic suggests those Libor rates should be higher than sovereign borrowing rates.
After all, triple A-rated central government is supposed to the safest thing about. But now, as my colleagues Michael Mackenzie and David Oakley first reported two weeks ago, something bizarre is going on. Back in late 2008, after the collapse of Lehman Brothers, the 30-year swap spread turned negative, when the markets froze amid wider financial chaos.
At the time, that swing did not grab many headlines, partly because the 30-year market garners little attention in the US. However, last week the closely watched – and vastly more influential – benchmark 10-year swap spread turned negative too, as 10-year Treasury yields spiralled up towards 4 per cent and above the 10-year swap rate.
That may simply be a temporary aberration. After all, the swaps market is not a perfect barometer of macroeconomic conditions and some unusual supply-demand imbalances seem to be distorting the market.
One issue affecting spreads, for example, is that investors are changing the way that they hedge mortgage rate risk, since the Federal Reserve is due to stop buying mortgage backed securities on Tuesday. A second factor is that more pension funds are trying to use swaps for meeting long-dated liabilities, rather than commit capital to buying bonds, at a time when government bonds are losing their scarcity value because of massive issuance.
At the same time, a flood of corporate issuance has left an unusually high number of entities swapping their fixed liabilities for floating exposures. More importantly still, there are rumours that some banks and hedge funds have recently suffered losses because they were wrong-footed by the swap swing. If so, they may be trying to cut their positions, thus exacerbating market movements.
However, there is another, less benign explanation for what is going on: namely that what we are seeing is a “canary in the coal mine” (to use the pithy image used by Alan Greenspan, former Fed chairman, last week), heralding future government bond market trouble and investor panic.
Think back, for a moment, to the early summer of 2007, or just before the start of the subprime meltdown. Back then, it was not the equity and credit markets that signalled disaster. Instead, the main sign of spreading investor alarm was that prices started to swing in the more obscure world of credit derivatives indices (such as ABX) and asset-backed commercial paper (ABCP).
This time round, is the swaps market another version of, say, ABX? Perhaps not yet. Personally, I will be astonished if countries such as the UK and US entirely avoid a government bond market shock; but I also suspect that this will occur some time down the road.
Nevertheless, if nothing else, the swaps spread swing does suggest that some investors are getting jittery. It also serves to underline that we do not live in “normal” markets right now. While the surface may look calm, the inner cogs of the financial system have been distorted by government intervention in ways that are still barely understood.
That, coupled with spiralling levels of government debt, has the potential to cause all manner of investment assumptions to go awry. Some trading desks and hedge funds are probably already counting the cost of that; as I noted above, the swaps spread swing has almost certainly created losses somewhere, given that it was not factored into most trading models.
But the story is unlikely to stop there. If we are moving into a world where government debt is no longer automatically deemed “risk-free”, partly because it no longer has any scarcity value, this will be a different world to the one investors know. In the months ahead, in other words, investors and politicians had better keep watching this swaps “canary”. Especially (but not exclusively) in the ever-expanding Treasuries world.
Tuesday, March 30, 2010
Monday, March 29, 2010
The Irrelevance of ObamaCare
Much has been said about the recent passage of the so-called ObamaCare. What hasn’t been said is that it is pretty much irrelevant in term of fiscal possibility. Sure, through budget gymnastics the powers-that-be were able to convey that “free healthcare” is not only affordable but also free. No, not free in the sense that partakers will not have to fork out anything when visiting a doctor, but free in the sense that it won’t add to the government deficit. Right! It will be anything but that. Since politicians can rarely do simple arithmetic, I’ll do it on their behalf. Consider the following:
1. Unfunded liabilities of Social Security, Medicaid, and Medicare are approximately $100 trillion (yes, trillions; it is not a typo). This was estimated by the Federal Reserve Bank of Dallas. [See Here]. And as my previous post reported, Social Security will pay out more this year than it will receive.
2. The federal government debt is currently $12.6 trillion. [See Here]
3. The federal government will add about an extra $9 trillion over the next decade. [See Here]
On a second thought, you do the math.
Against this backdrop, ObamaCare and all other government promises are a pipe dream. I dare say at least 80% of the population (using Pareto's Law) are in the dark about the economic standing of our nation. Only when it is too late they will understand.
Social Security Insanity
By Addison Wiggin
03/29/10 Baltimore, Maryland – Wanted: Accountants to oversee government fund. Employer seeks relative accuracy, margin of error +/-30%. GED preferred. Optimism required. Candidates to be compensated at market value plus $50,000. No calls please.
The Congressional Budget Office now predicts the Social Security fund will pay out more than it earns starting this year – as in it’s happening right now.
That’s just a shade off of last year’s forecast, which expected the fund to run a deficit starting in late 2016. And a far cry from the CBO data we used while making I.O.U.S.A. in 2007 and 2008.
 And as you can see, the fund is not just dipping its toes in deficit waters. The current forecast reveals a torrential drop from $20 billion surplus to $29 billion shortfall since we premiered the film on Aug., 22, 2008 – before we knew who the current president would be… and, more importantly, before Lehman Bros. crumbled.
Surely, some sort of unpredictable catastrophe precedes such a revision… something that wasn’t even on the national radar in 2009:
“The problem,” The New York Times helpfully suggests, “is that payments have risen more than expected during the downturn, because jobs disappeared and people applied for benefits sooner than they had planned. At the same time, the program’s revenue has fallen sharply, because there are fewer paychecks to tax.”
Really. Who could have seen that coming?
03/29/10 Baltimore, Maryland – Wanted: Accountants to oversee government fund. Employer seeks relative accuracy, margin of error +/-30%. GED preferred. Optimism required. Candidates to be compensated at market value plus $50,000. No calls please.
The Congressional Budget Office now predicts the Social Security fund will pay out more than it earns starting this year – as in it’s happening right now.
That’s just a shade off of last year’s forecast, which expected the fund to run a deficit starting in late 2016. And a far cry from the CBO data we used while making I.O.U.S.A. in 2007 and 2008.
And as you can see, the fund is not just dipping its toes in deficit waters. The current forecast reveals a torrential drop from $20 billion surplus to $29 billion shortfall since we premiered the film on Aug., 22, 2008 – before we knew who the current president would be… and, more importantly, before Lehman Bros. crumbled.Surely, some sort of unpredictable catastrophe precedes such a revision… something that wasn’t even on the national radar in 2009:
“The problem,” The New York Times helpfully suggests, “is that payments have risen more than expected during the downturn, because jobs disappeared and people applied for benefits sooner than they had planned. At the same time, the program’s revenue has fallen sharply, because there are fewer paychecks to tax.”
Really. Who could have seen that coming?
Saturday, March 27, 2010
Swap Rates vs. Treasury Rates
Following on my previous post regarding swap rates falling below treasury rates, this is a phenonon not only evident in the U.S. market but also in the UK. In Europe, the relationship is “normal.” Read the following excerpt below from a report published in today’s FT.
For the first time since swaps emerged in the mid-1980s, the 10-year swap rate traded below that of the "risk free" 10-year Treasury yield. Analysts say this reflects how government debt issuance has altered the dynamics between "risk-free" yields and swaps, which reflect borrowing costs for non-sovereign borrowers.
In the UK, swap rates have been below those of 10-year gilt yields since January. The yield on 10-year gilts was at 4.03 per cent yesterday, up from a low of 3.91 per cent earlier this week. The peak yield so far this year was 4.27 per cent in February. In Europe, however, swap rates are 20 basis points higher than 10-year yields.
"If we get clarity on what the UK will do on deficit reduction once the election is behind us, then the market and gilt yields could stabilise," says Mike Amey, UK portfolio manager for Pimco. Since the UK budget on Wednesday, the negative spread, or inversion, has widened with swap rates trading nearly 20 basis points below gilts for 10-year maturities compared with a negative spread of 10bps just before the government statement on public finances.
In other words, huge issuance is already creating unexpected distortions and stresses in the market. It is far from clear that we have seen the last of them, given the amounts that still need to be raised.
Loosing Ground: U.S. Treasurys
Signaling the difficulties ahead for the U.S. government debt market, another historic moment occurred this week: the 10-year swap rates falling below the 10-year Treasury yield (see the Financial Times report below). Since the swaps market’s inception, this had never happen. Swap rates should be trading above Treasury rates simply because the risk characteristics of the latter are less vis-à-vis the former. Swap rates, in layman terms, provide a reference into what the borrowing costs of a non-government borrower would be. Treasury rates are the anchor known as the “risk-free” rate used in many cash flow discounting scenario analysis. What can be said about such analysis when an alternate, yet imperfect substitute, risk-free interest rate moves higher? The answer: misleading. Fundamentally, this is why capital markets all around are significantly overvalued.
=======================================
Flight from Treasuries to swaps increases
By Michael Mackenzie in New York
Published: March 25 2010 (Financial Times)
Tuesday's historic inversion between US swap rates and 10-year Treasury yields intensified yesterday, as traders were forced to cut loss-making positions and investors dumped cash bonds in favour of derivatives ahead of the ending of the first quarter next week.
At the peak of the selling pressure yesterday, swap rates fell nearly 10 basis points below the yield on US Treasuries. On Tuesday, the swap rate closed 2bp below Treasury yields, the first time since swaps emerged in the 1980s that there has been an inversion between triple A rated Treasuries and lower-rated money market rates.
Falling swap rates coincided with the yield on 10-year Treasury notes jumping to 3.85 per cent from 3.70 per cent, as loss-making trades between swaps and government paper were cut by traders. The rate for seven-year swaps also fell below that of seven-year Treasury yields for the first time yesterday.
Swap rates typically trade at a premium to Treasury yields as their funding cost, Libor, is higher than that of "risk free" Treasuries. However, heavy Treasury debt issuance has helped drive the recent inversion. Analysts say that the proximity of quarter-end was another driver of inversion as investors do not want to hold cash bonds on balance sheets and would rather use swaps, which are off-balance instruments.
"This is a combination of corporate issuance and the fact that swaps are less balance-sheet intensive than Treasuries ahead of the quarter-end," said Ales Li, strategist at Credit Suisse.
Swap rates have slowly narrowed against the backdrop of record government debt issuance after trading 60bp above Treasuries in 2008.
Analysts say the inversion may hold for some time as investors stretch for yield beyond Treasuries, as they need to invest this year's strong inflows into bond funds from money market funds.
"The rate is a signal that the market has a huge appetite for alternative spread product to Treasuries," said Brian Yelvington, strategist at Knight Libertas Research.
Friday, March 26, 2010
Debtor Nation
by James Turk
Only a few decades ago, the United States was the world's largest creditor nation. American capital spanned the globe financing all types of investments in virtually every country. But that dominance began to erode in the 1960s because growth in consumption in the United States was starting to outpace new production. Wealth built up over generations was being consumed.
To compensate for the resulting decline in living standards, the nation turned to debt, rather than hard work and savings. This trend continued through the next decade. A focus on consumption and a seemingly unstoppable reliance on debt at all levels of American society had become the dominant force in economic activity.
By the 1980s, the inevitable happened. As generations of accumulated wealth disappeared, a line was crossed. America now owed more to the rest of the world than the world owed to it. The United States had become a debtor nation, and it has continued to run up the tab in the decades since.
The mindset of policymakers today continues to be one of debt and consumption instead of savings, investment and production. We see this way of thinking in their pronouncements and actions. Worryingly, the tipping point appears to have been reached. Not only is the United States living beyond its means, it is now borrowing beyond its means, as graphically illustrated in the following chart prepared by Nathan Martin.
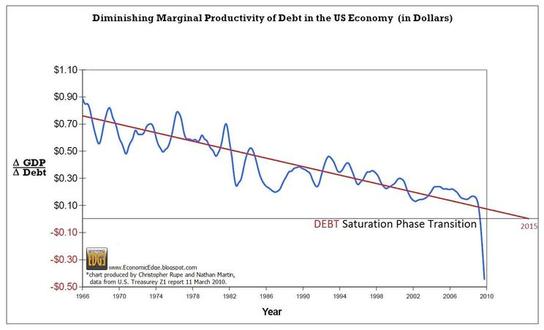
Here's is how Mr. Martin explains the crucial message from this chart.
As I see it, a lot of the federal government's promises are about to be broken. The collapse of the once almighty dollar is rapidly approaching.
Only a few decades ago, the United States was the world's largest creditor nation. American capital spanned the globe financing all types of investments in virtually every country. But that dominance began to erode in the 1960s because growth in consumption in the United States was starting to outpace new production. Wealth built up over generations was being consumed.
To compensate for the resulting decline in living standards, the nation turned to debt, rather than hard work and savings. This trend continued through the next decade. A focus on consumption and a seemingly unstoppable reliance on debt at all levels of American society had become the dominant force in economic activity.
By the 1980s, the inevitable happened. As generations of accumulated wealth disappeared, a line was crossed. America now owed more to the rest of the world than the world owed to it. The United States had become a debtor nation, and it has continued to run up the tab in the decades since.
The mindset of policymakers today continues to be one of debt and consumption instead of savings, investment and production. We see this way of thinking in their pronouncements and actions. Worryingly, the tipping point appears to have been reached. Not only is the United States living beyond its means, it is now borrowing beyond its means, as graphically illustrated in the following chart prepared by Nathan Martin.
Here's is how Mr. Martin explains the crucial message from this chart.
"This is a very simple chart. It takes the change in GDP and divides it by the change in Debt. What it shows is how much productivity is gained by infusing $1 of debt into our debt backed money system.
Back in the early 1960s a dollar of new debt added almost a dollar to the nation's output of goods and services. As more debt enters the system the productivity gained by new debt diminishes…[but now] total income can no longer support total debt. In the third quarter of 2009 each dollar of debt added produced NEGATIVE 15 cents of productivity, and at the end of 2009, each dollar of new debt now SUBTRACTS 45 cents from GDP!"
The US is digging itself into a hole, and if the message in the above chart was not clear enough, another bell tolled last week. Moody's warned that the triple-A credit rating of the United States is at risk of being downgraded if the nation fails to come to grips with its growing debt. It warned:"Preserving debt affordability at levels consistent with Aaa ratings will invariably require fiscal adjustments of a magnitude that, in some cases, will test social cohesion." [Emphasis added]
It is an unusually stark assessment with profound implications that require thoughtful attention. Debt has always been and will always be a two-edged sword. Iceland now knows that lesson well. So do Dubai and Greece. Other nations – including the United States – are about to learn that lesson too.As I see it, a lot of the federal government's promises are about to be broken. The collapse of the once almighty dollar is rapidly approaching.
Housing Woes: Single-Family Home Prices
[Thanks to www.chartoftheday.com]
For some perspective into the all-important US real estate market, today's chart illustrates the US median price of a single-family home over the past 40 years. Not only did housing prices increase at a rapid rate from 1991 to 2005, the rate at which housing prices increased -- increased. That brings us to today's chart which illustrates how housing prices have dropped 35% from the 2005 peak. In fact, a home buyer who bought the median priced single-family home at the 1979 peak has actually seen that home lose value (4.3% loss). Not an impressive performance considering that over three decades have passed. It is worth noting that the median priced home has moved back to the top of a trading range that existed from the late 1970s into the mid-1990s.

For some perspective into the all-important US real estate market, today's chart illustrates the US median price of a single-family home over the past 40 years. Not only did housing prices increase at a rapid rate from 1991 to 2005, the rate at which housing prices increased -- increased. That brings us to today's chart which illustrates how housing prices have dropped 35% from the 2005 peak. In fact, a home buyer who bought the median priced single-family home at the 1979 peak has actually seen that home lose value (4.3% loss). Not an impressive performance considering that over three decades have passed. It is worth noting that the median priced home has moved back to the top of a trading range that existed from the late 1970s into the mid-1990s.
Tuesday, March 23, 2010
Obama Pays More Than Buffett as U.S. Risks AAA Rating
March 22 (Bloomberg) -- The bond market is saying that it’s safer to lend to Warren Buffett than Barack Obama.
Two-year notes sold by the billionaire’s Berkshire Hathaway Inc. in February yield 3.5 basis points less than Treasuries of similar maturity, according to data compiled by Bloomberg. Procter & Gamble Co., Johnson & Johnson and Lowe’s Cos. debt also traded at lower yields in recent weeks, a situation former Lehman Brothers Holdings Inc. chief fixed-income strategist Jack Malvey calls an “exceedingly rare” event in the history of the bond market.
The $2.59 trillion of Treasury Department sales since the start of 2009 have created a glut as the budget deficit swelled to a post-World War II-record 10 percent of the economy and raised concerns whether the U.S. deserves its AAA credit rating. The increased borrowing may also undermine the first-quarter rally in Treasuries as the economy improves.
“It’s a slap upside the head of the government,” said Mitchell Stapley, the chief fixed-income officer in Grand Rapids, Michigan, at Fifth Third Asset Management, which oversees $22 billion. “It could be the moment where hopefully you realize that risk is beginning to creep into your credit profile and the costs associated with that can be pretty scary.”
Moody’s Warning
While Treasuries backed by the full faith and credit of the government typically yield less than corporate debt, the relationship has flipped as Moody’s Investors Service predicts the U.S. will spend more on debt service as a percentage of revenue this year than any other top-rated country except the U.K. America will use about 7 percent of taxes for debt payments in 2010 and almost 11 percent in 2013, moving “substantially” closer to losing its AAA rating, Moody’s said last week.
“Those economies have been caught in a crisis while they are highly leveraged,” said Pierre Cailleteau, the managing director of sovereign risk at Moody’s in London. “They have to make the required adjustment to stabilize markets without choking off growth.”
Advanced economies face “acute” challenges in tackling high public debt, and unwinding existing stimulus measures will not come close to bringing deficits back to prudent levels, said John Lipsky, first deputy managing director of the International Monetary Fund.
Unprecedented Spending
All G7 countries, except Canada and Germany, will have debt-to-GDP ratios close to or exceeding 100 percent by 2014, Lipsky said in a speech yesterday at the China Development Forum in Beijing. Already this year, the average ratio in advanced economies is expected to reach the levels seen in 1950, after World War II, he said.
Obama’s unprecedented spending and the Federal Reserve’s emergency measures to fix the financial system are boosting the economy and cutting the risk of corporate failures. Standard & Poor’s said the default rate will drop to 5 percent by year-end from 10.4 percent in February.
Bonds sold by companies have returned 3.24 percent this year, including reinvested interest, compared with a 1.55 percent gain for Treasuries, Bank of America Merrill Lynch index data show. Returns exceeded government debt by a record 23 percentage points in 2009.
Berkshire Hathaway
Berkshire Hathaway’s 1.4 percent notes due February 2012 yielded 0.89 percent on March 18, 3.5 basis points, or 0.035 percentage point, less than Treasuries, composite prices compiled by Bloomberg show. The Omaha, Nebraska-based company, which is rated Aa2 by Moody’s and AA+ by S&P, has about $157 billion of cash and equivalents and about $52 billion of debt.
P&G, the world’s largest consumer-products maker, saw the yield on its 1.375 percent notes due August 2012 fall to 1.12 percent on March 18, 6 basis points below government debt. The Cincinnati-based company, rated Aa3 by Moody’s and AA- by S&P, makes everything from Tide detergent to Swiffer dusters.
New Brunswick, New Jersey-based Johnson & Johnson’s 5.15 percent securities due August 2012 yielded 1.11 percent on Feb. 17, 3 basis points less than Treasuries, according to Trace, the bond-price reporting system of the Financial Industry Regulatory Authority. The world’s largest health products company is rated AAA by S&P and Moody’s.
Yields on bonds of home-improvement retailer Lowe’s in Mooresville, North Carolina, drugmaker Abbott Laboratories of Abbott Park, Illinois, and Toronto-based Royal Bank of Canada have also been below Treasuries, Trace data show.
‘Avalanche’
“It’s a manifestation of this avalanche, this growth in U.S. Treasury supply which is under way and continues for the foreseeable future, and the comparative scarcity of high-quality credit,” particularly in shorter-maturity debt, said Malvey, whose Lehman team was ranked No. 1 in fixed-income strategy by Institutional Investor magazine from 1998 through 2007.
Last year’s $2.1 trillion in borrowing by the government exceeded the $1.08 trillion issued by investment-grade companies, the biggest gap ever, Bloomberg data show. Malvey said the last time he can recall that a corporate bond yield traded below Treasuries was when he was head of company debt research at Kidder Peabody & Co. in the mid-1980s.
While Treasuries are poised to make money for investors this quarter, they are losing momentum. The securities are down 0.43 percent in March after gaining 0.4 percent last month and 1.58 percent in January, Bank of America Merrill Lynch indexes show.
Benchmark 10-year Treasury yields will reach 4.20 percent by year-end, up from 3.69 percent last week, according to the median forecast of 48 economists in a Bloomberg News survey. Two-year yields will rise to 1.77 percent, from 0.99 percent.
Relative Yields
Investors demand 0.60 percentage point more in yield to own 10-year Treasuries than German bunds of similar maturity, Bloomberg data show. A year ago, debt of Germany, whose deficit is 4.2 percent of its economy, yielded about half a percentage point more than Treasuries.
President Obama’s budget proposal would create bigger deficits every year of the next decade, with the gaps totaling $1.2 trillion more than his administration projects, the nonpartisan Congressional Budget Office said this month. Publicly held debt will zoom to $20.3 trillion, or 90 percent of gross domestic product, by 2020, the CBO forecast.
There’s “a lack of a long-term plan to deal with the federal budget deficit,” said Gary Pollack, who helps oversee $12 billion as head of fixed-income trading at Deutsche Bank AG’s Private Wealth Management unit in New York. “At some point in time the market may lose its patience.”
Balance Sheets
Deutsche Bank and Barclays Plc, two of the 18 primary dealers of U.S. government securities that are obligated to bid at the Treasury’s auctions, say balance sheets of high-rated companies make them more attractive than Treasuries.
Corporate borrowers are reducing debt at a record pace. Companies in the S&P 500 cut their liabilities by $282 billion to $7.1 trillion in the fourth quarter from the prior three months, Bloomberg data show. That represents 28 percent of assets, the least in at least a decade.
Investors are accepting smaller premiums to lend to companies, with yields on bonds rated at least AA falling to within 107 basis points of Treasuries on average, Bank of America Merrill Lynch indexes show. That’s down from the peak of 515 basis points in November 2008, and approaching the record low of 36 in 1997.
Adding to Corporates
New York Life Investment Management is adding to bets the difference in yields will continue to shrink.
“As the balance sheet of corporate America continues to improve and the balance sheet of the government deteriorates, that spread should narrow,” said Thomas Girard, a senior money manager who helps invest $115 billion at the New York-based insurer. “There is some sort of breaking point. The federal government can’t keep expanding its borrowing without having to incur some costs.”
For all the concern about U.S. finances, Treasuries are unlikely to lose their role as the world’s borrowing benchmark, said Michael Cheah, who manages $2 billion in bonds at SunAmerica Asset Management in Jersey City, New Jersey. The U.S. has the biggest, most liquid securities markets, said Cheah.
Speculating that Treasuries may lose their privileged position is “not a bet I want to put on,” said Cheah, who worked at Singapore’s central bank. Yields on 10-year notes are about half their average since 1980.
Losing its Status
The last time there was talk of the U.S. losing its status as the world’s benchmark for bonds was in the late 1990s, when the government began amassing budget surpluses in 1998 for the first time in almost three decades. The amount of Treasuries outstanding dropped 8 percent to $3.4 trillion in 2000, the biggest annual decline since 1946.
Treasury supply resumed growing in 2001 after two rounds of tax cuts proposed by President George W. Bush led to deficits. Outstanding Treasury supply rose 53 percent to $4.5 trillion in 2007 from 2000 as the U.S. borrowed to finance tax cuts intended to revive a slumping economy. The amount has since risen 64 percent to $7.4 trillion.
More is on the way. The U.S. will sell a record $2.43 trillion of debt in 2010, according to the average forecast of 10 of the 18 primary dealers in a Bloomberg survey.
At the same time Treasury sales are rising, the cash position of the largest corporations is swelling. Companies in the S&P 500 held a record $2.3 trillion as of the fourth quarter, Bloomberg data show.
Growing Supply
High-rated corporate bonds due in three to five years are most likely to yield less than Treasuries, according to Deutsche Bank’s Pollack. The growing supply of Treasuries with those maturities will make government debt a bigger proportion of indexes that fund managers measure their performance against, he said. Managers betting Treasury yields will rise may diversify into corporate debt, Pollack said.
“There’s no natural law that says a Treasury has to yield less than a corporate,” said Daniel Shackelford, who is part of a group that manages $18 billion in bonds at T. Rowe Price Group Inc. in Baltimore. “It wouldn’t be the first time that I would scratch my head and say ‘this doesn’t make sense, the market’s behaving irrationally.’ And it can go on for much longer than you may think.”
Monday, March 22, 2010
Foreign Demand For U.S. Treasurys - The Chinese Version
Some popular media are obsessed with China’s economic stronghold over the U.S. economy, namely in the form of a massive accumulation of Treasurys. Although “experts” and government bureaucrats extol the virtues of an independent Federal Reserve, the fact of the matter is that this is a moot point—particularly in light of excessive dollar reserves (in US debt) held by China. Dumping a large portion of its dollar-based portfolio would send the financial markets into a tailspin: interest rates would immediately rise, default prospects of the U.S. government would become quite evident, and an avalanche of fear would no doubt engulf the markets.
Having said that, let me address one point that is not well understood these days: China discontinuing to (or slowing the) purchases of U.S. Treasurys. China will not do this until it completely abandons its fixed exchange rate policy. Consider this graph of the China/USD foreign exchange rate.
Having said that, let me address one point that is not well understood these days: China discontinuing to (or slowing the) purchases of U.S. Treasurys. China will not do this until it completely abandons its fixed exchange rate policy. Consider this graph of the China/USD foreign exchange rate.

Ever since June 2008, the People’s Bank of China (PBOC) has maintained a fixed value of conversion between the Yuan and the U.S. Dollar. This means that the monetary policy of China is the same as the one exercised by the Federal Reserve Bank. For example, when the FED prints money, the Chinese have to print money. This is because the value of any currency vs. another is strictly determined by supply and demand. A loose monetary policy increases the supply of money, thereby reducing its value in relation to other currencies.
From a Chinese perspective, a loose monetary policy by the FED causes its domestic supply of money to increase. In other words, when the FED prints money, the Yuan appreciates. In order to maintain a fixed exchange rate, the PBOC must purchase the sufficient amount of currency in the foreign exchange market in order to keep its currency within its predetermined target. The PBOC may try to sterilize the excess supply of Yuan by selling Yuan-denominated bonds in its domestic market, but such policy is rarely successful.
Let’s look closely the behavior of the Yuan/Dollar FX rate over the last 10 years.
From 2000 to late 2005 the exchange rate was fixed at approximately 8.30 CNY per $. From late 2006 to May 2008, the Chinese floated its currency, hence the appreciation. And since June 2008 the CNY has been fixed at rate approximately 6.82.
Against this background, let’s see what happened to Chinas’ US Dollar exchange reserves (in billions): [Foreign reserves data was obtained from here].
January 2000 to December 2005: up from $165 to $818
January 2006 to May 2008: up from $845 to $1,797
June 2008 to December 2009: up from $1,808 to $2,399
In short, US dollar reserves in the hands of the PBOC have ballooned. This is no surprised, given the fall of the U.S. dollar in international markets for most of the first decade of the 2000s: a depreciating currency forces a fixed exchange rate country to a loose monetary policy in order to maintain parity in the currency. When market participants expect continuous exchange depreciation in the anchored currency (i.e. the US dollar), capital inflow occurs in the fixed currency economy (i.e. China). It was under this scenario that China found itself with no other credible option than to revalue its currency after late 2005. The U.S. dollar continued to depreciate and hence China’s reserve continued to skyrocket.
Until China freely floats its currency in relation to the U.S. dollar, all talks about the PBOC sobering its purchase of Treasurys is tabloid journalism.
Saturday, March 20, 2010
Who Should You Pay Attention to? Not a Federal Reserve Bank Bureaucrat!
Thanks to Jim Rogers for speaking so eloquently! Enjoy the (4 mins 33 sec) video.
The Coming Financial Reckoning Day
Many financial market readings, as the one in my previous post, highlight the perception that the economic turmoil is past. Central bankers and politicians, adherents of Keynesian philosophy, have put themselves at the forefront of proclaiming they have saved the world from an economic depression. In short, Keynesian philosophy, which at its root is anti-free market and believes government intervention in an economy is required, is misguided. It believes in the “broken window fallacy.” It believes in something for nothing. It believes that the solutions to all economic problems are tax and spend. Never mind that this defunct philosophy was proved wrong by the events of history, particularly during the 1970s. Yet it is back with a vengeance; but it will end like it did in the past: discredited.
The effects of the Keynesian policies, which are displayed by way of fiscal intervention (i.e. government spending), are evident in market variables. Monetary policy is subservient to fiscal policy under Keynesian philosophy. That is, monetary policy should augment fiscal policy. In other words, if the government needs to spend, the central bank needs to print money. Of course, court economists and politicians never put this way, but rather use obscure language that make it seem they know what they are doing.
Consider this graph. It displays the ratio of the market value of high yield debt to the market value of investment grade debt (U.S. corporate debt). [See here for a brief description of the data behind this graph.]

Market value of all fixed income securities move in inverse relation to yield (or interest rates). That is, a high market value reveals lower yield; and vice versa, a low market value reveals a higher yield. High yield debt is the current name of what was known as “junk bonds,” which is the riskier debt traded in the market. Investment grade bonds, on the other hand, are of high credit quality and therefore carry less risk. The yield, as you might expect, reveals the level of risk attributed by the market.
The ratio denoted in the graph has increased due a combination of higher market value of high yield in relation to investment grade. As previously mentioned, higher market values reflect lower yields. This means that the return on high yield debt has declined faster in comparison to investment grade. Another way of expressing this is by saying that the risk in high yield bonds has declined faster than the risk in investment grade bonds. The graph, if anything, demonstrates investors chasing higher returns. The greater demand for high yielding securities pushes the perceived (not the actual) risk downward.
This scenario reminds me of Minsky’s Financial Instability Hypothesis (FIH). The FIH describes “hedge finance” as conservative financial arrangements. More specifically, Minsky’s FIH points out that an capitalist economic system
transits from financial relations that make for a stable system to financial relations that make for an unstable system.
In particular, over a protracted period of good times, capitalist economies tend to move from a financial structure dominated by hedge finance units to a structure in which there is large weight to units engaged in speculative and Ponzi finance. Furthermore, if an economy with a sizeable body of speculative financial units is in an inflationary state, and the authorities attempt to exorcise inflation by monetary constraint, then speculative units will become Ponzi units and the net worth of previously Ponzi units will quickly evaporate. Consequently, units with cash flow shortfalls will be forced to try to make position by selling out position. This is likely to lead to a collapse of asset values.
Although Misky was a proponent of some form of government intervention as a result of the instability he believe is inherent in capitalist economies, he nevertheless appropriately captures what is evident in terms of financial history. His conclusions are no less true today than they were when he first published his findings in 1992. Chasing higher yielding assets (and therefore risker assets) invariably pushes investors to "speculative and Ponzi units" of investment.
Therefore do not be amazed that we are following the same patters of the past. The next financial collapse will be of greater proportion than the 2008-2009, because of the excessive use of leverage.
Fool Me Once Shame on Me…Fool Me Twice Shame on?
This is the graph of the volatility index (ViX), commonly known in Wall St. as the “fear gauge.”
.jpg)
The ViX measures the implied volatility of the S&P 500 listed options. Options give the holder the right (but not the obligation) to buy/sell the underlying security for an agreed-upon price during a fixed amount of time. The index moves in opposite directions in market gyrations: that is, in times of excessive uncertainty the ViX declines, while during times of stability it declines. Currently, the ViX sits around 18. At the height of the financial crisis it reached a record high of 80.86. This manifestation gives the impression that risk has receded and markets are tamer. As can be noted from the graph, the index is at a level experienced prior the financial fallout. It take no rocket scientist to figure out that the massive manipulation of the market—by way of fiscal and monetary policy—has left the ViX number practically misleading. It is a backward looking indicator, meaning it merely represents what has happened in the past. It says nothing about the future.
Bear in mind also that the Index is priced using the Black-Scholes option pricing model, which at this time we would expect to underestimates risk. Why? Simple: because the model assumes volatility is constant (i.e. it won’t change) and financial markets reflect behavior that can be statistically assessed by the normal distribution curve. Acceptance of these assumptions are at the heart of why many of the brightest minds were not able to see the oncoming train wreck of 2008-2009 and it is why many believe we have passed the worst. Yet, the market is merely stirring towards the great collapse that is ahead of us. This is not an ideological point, but rather how the economic laws of cause and effect function.
Friday, March 19, 2010
Still Not Convinced Job Growth Is Coming? See This!!
(via Business Insider Commentary)
This relationship makes complete sense yet is frequently forgotten -- There has been a simple long-term correlation between U.S. power production and job growth, going back decades, as shown below.
U.S. power production fell with the recent economic downturn, most likely because there was less economic activity (plus some belt tightening when it came to energy usage).
Yet now it is rebounding. Which unless this relationship has suddenly changed, means that new jobs are highly likely to be created in the coming quarters.
The chart below is also interesting as a validation of the U.S. recovery because, right now, many who doubt the validity of Chinese government statistics look to Chinese power usage numbers as a tangible check on the economic growth that the government claims.
Well the same works for the U.S. It has passed the 'China' test!
Wednesday, March 17, 2010
Economists to Miss the Next Financial Crisis
By Bill Bonner [Daily Reckoning]
Beware the Ides of March…and the rest of the year too!
This is the day Caesar was assassinated. What’s it to us?
Well, it just reminds us that things go wrong. Even when you’re on top of the world. There are always countercurrents…undercurrents, beneath the surface, where you don’t see them…plots…conspiracies…and just bad luck.
On the surface, the US economy is recovering. Well, not even. It is stabilizing.
The Dow has been creeping up. It rose 12 points on Friday [3/12/2010]. Gold fell $6. Oil held at $81.
The most recent figures show the consumer becoming a little freer with his money. But look beneath the surface and you find government statisticians juking and jiving with the numbers. They seasonally adjusted downward the figures for January…which boosted the figures for February. Had they not done so, the figures for February would have been negative!
Still, consumers are not as lifeless as they have been…and on the surface, this is good news.
And who can blame consumers for being a little more ready to spend money? The newspapers tell us that the Great Recession is over…and that we’re in a recovery. The lumpen consumer probably thinks he’s going to find a job soon…and that his house is going up in price.
But beneath the surface, there are powerful downtrends still underway. These trends began in 2007. They were misinterpreted, naturally, by leading economists and policymakers as a “liquidity crisis.” In fact, they were signs of a debt crisis. The private sector had far too much debt.
Economists who never expected trouble, reacted to it in a predictably moronic way – they rushed to the rescue with more debt. Now, they think they’ve triumphed… They’ve prevented another Great Depression. They’ve saved the world!
We’re written so much about that; you surely don’t want to read any more on that subject.
But here’s the interesting point: by failing to address the real causes of the crisis, the feds only allowed those undercurrents to grow more powerful and more dangerous.
Instead of reducing the world economy’s reliance on debt, they increased it!
On the surface, the rescue efforts look vaguely like a success. The private sector stopped spending. Government increased its spending to make up for it. Okay so far.
Alas…net, the world’s debt is still increasing – by a huge margin. Over the next 3 years, the biggest 20 economies in the world – the G20 – are expected to slip over the 100% mark, with more debt than GDP.
Now, let’s do a little math. The US has total tax receipts equal to about 15% of GDP. If the interest on the debt is only, say, 3%…that means you’re spending 20% of tax receipts on debt service. But suppose inflation rises…and interest rates go back up to where they were in the late ’70s. Back then, the feds had to pay 15% interest to borrow money for 10 years. At that rate, financing the whole federal debt would take 100% of tax revenues – just for the interest.
Obviously, that’s not gone to happen. Something else is going to happen. What? Hard to say. Some combination of default and inflation, most likely…
Of course, this doesn’t bother the feds. That story is still beneath the surface… It’s a crisis that hasn’t happened yet. They couldn’t see the crisis in the public sector coming in ’07. They can’t see the next one coming either.
Economists can’t tell a government job from a private sector job…and can’t tell $1 of government spending from a dollar spent by the private sector…and can’t tell a dollar’s worth of GDP from a dollar’s worth of real prosperity…
…which means, they can’t tell the difference between what’s happening on the surface to what’s happening underneath.
In a sense, this is just another manifestation of the same “battle” we wrote about years ago. On one side are the feds. On the other is Mr. Market.
The feds want to inflate. Mr. Market wants to deflate. The feds want a boom. Mr. Market wants a bust. The feds want to inflate another credit bubble. Mr. Market has a knife in his hand.
On the surface, the feds are winning. At least, that’s the way it looks if you get your information from reading the newspapers or listening to CNBC. And in a sense, these reports are correct. Superficially, the battle is going the feds’ way.
But deeper down…the debt is still there…and it is growing bigger. And Mr. Market sharpens his dagger.
Tuesday, March 16, 2010
Credit Default Swaps
[Article printed in The Economist. It aptly explain the heart of the issue regarding credit default swaps on government debt and politician's misguided attempt to ban them.]
Smokescreen:
Blaming speculators for sovereign-debt woes is misguided. Banning them would be worse
GREECE had a budget deficit of 12.7% of GDP in 2009. It has a record of dodgy accounting. Its own leaders acknowledge how dire its fiscal situation is. George Papaconstantinou, the country’s finance minister, summed it up pretty well last month. “People think we are in a terrible mess. And we are.”
That hasn’t stopped his boss, George Papandreou, and other European leaders from jabbing fingers elsewhere. To judge by this week’s political rhetoric, the blame for Greece’s woes lies largely with speculators, who stand accused of buying sovereign credit-default swaps (CDSs), a form of insurance against government default, in the hope of profiting from jitters about sovereign debt. “Unprincipled speculators are making billions every day by betting on a Greek default,” said Mr Papandreou in a speech in Washington, DC.
The wheels of policy are now turning. The European Commission has said it will examine the case for banning “naked” sovereign CDSs, in which buyers of protection on government debt do not actually own any of the underlying bonds. A European ban would not do much good on its own: trading would simply move to other markets. The official American response to Mr Papandreou has been tepid. But the issue is on the G20’s radar. The Financial Stability Board, which is co-ordinating international financial reform, thinks that tighter rules are likely.
Some reform of the market for sovereign CDSs is needed. Like other credit-default swaps, there is a strong case for moving these over-the-counter instruments on to central clearing-houses, which stand between buyers and sellers and reduce counterparty risk. Sensible changes of this kind are already in train in Europe and America. But the idea that speculators are to blame for Greece’s troubles is wrong-headed, and the solution of banning naked sovereign CDSs is even worse.
First, the diagnosis. The case against buyers of sovereign CDSs is that by driving up the price of insuring against default, they cause spreads on underlying cash bonds to widen, making borrowing more expensive and bringing default—and a big payout—closer. That drives up the price of insurance further, setting the cycle in motion again. The problem with this analysis is that the tail is far too puny to wag the dog. There are $9 billion of net Greek sovereign CDSs outstanding, compared with more than $400 billion of Greek government bonds. It is a similar story in other countries under pressure. According to the Bank for International Settlements, the proportion of net CDS positions to government debt is highest in Portugal, at just 5%. Moreover, CDS and bond prices have tended to move together, rather than one driving the other.
Naked self-interest
Even so, surely it cannot be right for people who do not own any government debt to profit from sovereign distress? Actually, it can. When states get into trouble, other borrowers suffer too: taxes rise, economies slow. So investors in Greek companies have legitimate reason to protect themselves against Greek sovereign risk. If they cannot, they will simply charge companies a higher risk premium instead. Buyers of protection also have to find sellers—banks, say, or hedge funds. But sellers want to offload their risk as well. If sellers are not allowed to buy protection themselves, investors will find it harder to hedge. If so, banning naked CDSs could end up making it more expensive for governments to borrow.
There is a long tradition of shooting messengers who bring bad news. But the simple explanation for rising borrowing costs—Greece’s finances are tatty—makes far more sense than the complex, politically convenient one. The sovereign-CDS debate is a smokescreen to obscure an unpalatable truth.
Saturday, March 13, 2010
S&P 500 PE Ratio
[Thanks to Chart of the Day: http://www.chartoftheday.com/]
Today's chart illustrates how the recent rise in earnings has impacted the current valuation of the stock market as measured by the price to earnings ratio (PE ratio). Generally speaking, when the PE ratio is high, stocks are considered to be expensive. When the PE ratio is low, stocks are considered to be inexpensive. From 1936 into the early 1990s, the PE ratio tended to peak in the low 20s (red line) and trough somewhere around seven (green line). The price investors were willing to pay for a dollar of earnings increased during the dot-com boom (late 1990s), surged even higher during the dot-com bust (early 2000s), and spiked to nosebleed levels during the financial crisis (late 2000s). Currently, with 99% of US corporations having reported for Q4 2009, the PE ratio stands at 22 which is at the high end of a range that existed from the mid-1930s up until the early 1990s.

No Risk and High Reward...or so it seems!
Money printing by Federal authorities, or more precisely the Federal Reserve, distorts market incentives by way of pricing. Consider the following two items reported this week in the Financial Times:
The spread on the 30-year Fannie Mae current coupon bond - a benchmark for the sector - this week fell to 57 basis points over US Treasuries, the lowest ever, according to Mahesh Swaminathan, mortgage strategist at Credit Suisse.And
Since a year ago, 204 stocks in the S&P 500 index are up 100 per cent or more, 33 are 300 per cent higher or more and two are up 1,000 per cent or more, according to Capital IQ.
[see here and here for the complete articles where these quotes come from.]
These two measures indicate risk has retrenched and happy days are here again. Yet in light of the tremendous risks that still lurk out there, there is very little that would warrant the level of decrease in the aforementioned variables. Spreads have narrowed as a result of the FED purchasing $1.2 trillion worth of Agency debt and stocks expanded as a result of massive government intervention (see previous post).Money Printing & The Stock Markets 2009 - 2010
The world major stock markets have performed extraordinarily over the last 12+ months. This is clearly evident by the following graph, which demonstrates the trend for said time period.
 Nevertheless, what is less often asked is from where is the required funding coming from. Has productivity significantly increased? Has investment increased? Or has some other demand and/or supply shock occurred? The answers to these questions are clearly no. Massive government intervention, which also includes those of monetary authorities, all over the world have had a significant impact in generating the sentiments to cause the stock market to go up. Something cannot come from nothing: money printed has flooded the markets. The U.S. dollar is presently the world reserve currency. As long as this continues to be the case, Federal Reserve policy (i.e. FOMC) will invariably and disproportionately influence the markets.
Therefore, it is of no coincidence that the adjusted monetary base, the mount of money printed by the U.S. central bank, has equally expanded (in absolute terms). Notice the trend; it is almost identical in both charts.

“Austrian” Theory of the Business Cycle tells us that the pursued economic policies, although causing a momentary and illusory restoration of economic stability, are sowing the seeds of the next crisis. It is difficult to appreciate any other time in history where there have been no major wars and fiscal discipline being excessively out of order. The “Austrian” economists, whom I count myself to be among them, were the only ones who called the 2008 economic collapse. We are the voice in the wilderness warning those who are being led by false economic prophets. Timing is difficult to predict, but as each day passes by, we are getting closer to our next political and economic crisis. Unless dramatic and unprecedented (at least in terms of our generation) changes in policies and incentives take place, this is a foregone conclusion.
 Nevertheless, what is less often asked is from where is the required funding coming from. Has productivity significantly increased? Has investment increased? Or has some other demand and/or supply shock occurred? The answers to these questions are clearly no. Massive government intervention, which also includes those of monetary authorities, all over the world have had a significant impact in generating the sentiments to cause the stock market to go up. Something cannot come from nothing: money printed has flooded the markets. The U.S. dollar is presently the world reserve currency. As long as this continues to be the case, Federal Reserve policy (i.e. FOMC) will invariably and disproportionately influence the markets.
Therefore, it is of no coincidence that the adjusted monetary base, the mount of money printed by the U.S. central bank, has equally expanded (in absolute terms). Notice the trend; it is almost identical in both charts.
“Austrian” Theory of the Business Cycle tells us that the pursued economic policies, although causing a momentary and illusory restoration of economic stability, are sowing the seeds of the next crisis. It is difficult to appreciate any other time in history where there have been no major wars and fiscal discipline being excessively out of order. The “Austrian” economists, whom I count myself to be among them, were the only ones who called the 2008 economic collapse. We are the voice in the wilderness warning those who are being led by false economic prophets. Timing is difficult to predict, but as each day passes by, we are getting closer to our next political and economic crisis. Unless dramatic and unprecedented (at least in terms of our generation) changes in policies and incentives take place, this is a foregone conclusion.
The Art of Fiscal Illusion
Keynesian philosophy (KP) would be quite comical were it not for the fact that it’s caused major economic and political imbalances over the last 70+ years. I used to be a Keynesian proponent until I awoke from my deep psychological sleep. It took a while for the deconstruction and re-composition (if you will) of my mental faculties from many years of economic brainwashing. One of the things that prospective (or novice) economists are taught is art of accepting theories and concepts that are contradictory. In other words, cognitive dissonance is the pillar of KP.
The following is a quote from a recent article published in The Economist. Read it and see if you notice anything that particularly jumps out.
So here it is: the fact that either The Economist is confused as to which position to take or accept a contradiction as their foundation of how the world works.
In simple English, this is what they are saying: government intervention was necessary to save the world. Oh, but wait, “studies suggest that fiscal adjustments that rely on spending cuts do better than those based on tax rises.”
The Economists misses the obvious: if one thing is true, it’s opposite cannot be. For example, if they claim that cutting government spending is good, then raising government spending is not good. However, back in 2008/2009, at the height of the bailouts, government spending was skyrocketing. They never explain why they accept spending cuts now but not a couple of years ago.
Followers of KP are being heralded with saving the economy. Major liberal (in terms of economics philosophy) publications, such as The Economist, agree with this assertion. Yet, like most of the Western government, KP is fundamentally bankrupt. It is only a matter of time before this becomes widely evident.
The following is a quote from a recent article published in The Economist. Read it and see if you notice anything that particularly jumps out.
Notice anything…no? Go back and read it again.The state had to step in during the credit crunch, given the scale of the banking crisis, but this expansion of its scope should be temporary. This is not just ideological bias on our part; economic studies suggest that fiscal adjustments that rely on spending cuts do better than those based on tax rises. Yes, some tax rises may be necessary, if only out of the political necessity of persuading the electorate that the burden is being shared. But tax rises, like Japan’s in 1997, can kill a recovery.
So here it is: the fact that either The Economist is confused as to which position to take or accept a contradiction as their foundation of how the world works.
In simple English, this is what they are saying: government intervention was necessary to save the world. Oh, but wait, “studies suggest that fiscal adjustments that rely on spending cuts do better than those based on tax rises.”
The Economists misses the obvious: if one thing is true, it’s opposite cannot be. For example, if they claim that cutting government spending is good, then raising government spending is not good. However, back in 2008/2009, at the height of the bailouts, government spending was skyrocketing. They never explain why they accept spending cuts now but not a couple of years ago.
Followers of KP are being heralded with saving the economy. Major liberal (in terms of economics philosophy) publications, such as The Economist, agree with this assertion. Yet, like most of the Western government, KP is fundamentally bankrupt. It is only a matter of time before this becomes widely evident.
Friday, March 12, 2010
How to handle the sovereign debt explosion
By Mohamed El-Erian (Published: March 10 2010, Financial Times)
[Mr. El-Erian is CEO of PIMCO, one of the largest bond managers in the world. It is always wise to seriously consider what he has to say. I urge that you do so.]
Every once in a while, the world is faced with a major economic development that is ill-understood at first and dismissed as of limited relevance, and which then catches governments, companies and households unawares.
We have seen a few examples of this over the past 10 years. They include the emergence of China as a main influence on growth, prices, employment and wealth dynamics around the world. I would also include the dramatic over-extension, and subsequent spectacular collapse, of housing and shadow banks in the finance-driven economies of the US and UK.
Today, we should all be paying attention to a new theme: the simultaneous and significant deterioration in the public finances of many advanced economies. At present this is being viewed primarily – and excessively – through the narrow prism of Greece. Down the road, it will be recognised for what it is: a significant regime shift in advanced economies with consequential and long-lasting effects. To stay ahead of the process, we should keep the following six points in mind.
First, at the most basic level, what we are experiencing is best characterised as the latest in a series of disruptions to balance sheets. In 2008-09, governments had to step in to counter the simultaneous implosion in housing, finance and consumption. The world now has to deal with the consequences of how this was done.
US sovereign indebtedness has surged by a previously unthinkable 20 percentage points of gross domestic product in less than two years. Even under a favourable growth scenario, the debt-to-GDP ratio is projected to continue to increase over the next 10 years from its much higher base.
Many metrics speak to the generalised nature of the disruption to public finances. My favourite comes from Willem Buiter, Citi’s chief economist. More than 40 per cent of global GDP now resides in jurisdictions (overwhelmingly in the advanced economies) running fiscal deficits of 10 per cent of GDP or more. For much of the past 30 years, this fluctuated in the 0-5 per cent range and was dominated by emerging economies.
Second, the shock to public finances is undermining the analytical relevance of conventional classifications. Consider the old notion of a big divide between advanced and emerging economies. A growing number of the former now have significantly poorer economic and financial prospects, and greater vulnerabilities, than a growing number of the latter.
Third, the issue is not whether governments in advanced economies will adjust; they will. The operational questions relate to the nature of the adjustment (orderly versus disorderly), timing and collateral impact.
Governments naturally aspire to overcome bad debt dynamics through the orderly (and relatively painless) combination of growth and a willingness on the part of the private sector to maintain and extend holdings of government debt. Such an outcome, however, faces considerable headwinds in a world of unusually high unemployment, muted growth dynamics, persistently large deficits and regulatory uncertainty.
Countries will thus be forced to make difficult decisions relating to higher taxation and lower spending. If these do not materialise on a timely basis, the universe of likely outcomes will expand to include inflating out of excessive debt and, in the extreme, default and confiscation.
Fourth, governments can impose solutions on other sectors in the domestic economy. They do so by pre-empting and diverting resources. This is particularly relevant when there is limited scope for the cross-border migration of activities, which is the case today given the generalised nature of the public finance shock.
Fifth, the international dimension will complicate the internal fiscal adjustment facing advanced economies. The effectiveness of any fiscal consolidation is not only a function of a government’s willingness and ability to implement measures over the medium term. It is also influenced by what other countries decide to do.
These five points all support the view that the shock to balance sheets is highly relevant to a wide range of sectors and markets. Yet for now, the inclination is to dismiss the shock as isolated, temporary and reversible.
This leads to the sixth and final point. We should expect (rather than be surprised by) damaging recognition lags in both the public and private sectors. Playbooks are not readily available when it comes to new systemic themes. This leads many to revert to backward-looking analytical models, the thrust of which is essentially to assume away the relevance of the new systemic phenomena.
There is a further complication. Timely recognition is necessary but not sufficient. It must be followed by the correct response. Here, history suggests that it is not easy for companies and governments to overcome the tyranny of backward-looking internal commitments.
Where does all this leave us? Our sense is that the importance of the shock to public finances in advanced economies is not yet sufficiently appreciated and understood. Yet, with time, it will prove to be highly consequential. The sooner this is recognised, the greater the probability of being able to stay ahead of the disruptions rather than be hurt by them.
Monday, March 8, 2010
CBO Debt Projections: Make Room for “Crowding Out”
by Addison Wiggin (Daily Reckoning)
03/08/10 Baltimore, Maryland – The latest deficit projection from the Congressional Budget Office was conveniently revealed just prior to the close of business on Friday.
“Why so?” You ask suspiciously.
“Because,” we respond in a hushed tone.
The CBO’s latest numbers reveal that President Obama’s proposed fiscal 2011 budget would add $9.7 trillion to the national debt over the next 10 years. The White House projection is only slightly less staggering – $8.5 trillion.
Further, the CBO projects the national debt will be 90% of GDP by the end of this decade – higher than the 83.4% recorded at the end of fiscal 2009 last fall. We’re 100% certain this comment will elicit the customary response: “Look at Japan, its debt is 170% of GDP…and it’s been running massive deficits for years!”
To which we can only sigh and respond: “Exactly.” Then get back to our film in which we hope to illustrate the long-term deleterious effects caused by the “crowding out” effect, when governments spend their citizens’ future wealth…way ahead of schedule.
“We told you two months ago,” our economist-in-residence Rob Parenteau also revealed late on Friday, “we thought Greece would not default, it would begin to implement government spending cuts and tax hikes and there would be a backup fiscal assistance facility put in place for the region in the event bond auctions began to fail. So far, this is precisely how the scenario has played out.”
So far, so good.
But “the next act gets tougher to predict,” he cautions. “Greece and other countries now face falling private-sector incomes – that is, after all, the direct and immediate result of higher taxes on businesses and households and lower government expenditures. Unless the trade deficits of these nations can swing sharply into surpluses (as lower domestic incomes lead to less import demand and lower costs of production lead to higher exports), private debt defaults will now start to multiply and cascade through the system.
“Last week, Moody’s placed four Greek banks on downgrade watch. This is just the start – the fiscal retrenchment has only just begun to take effect. By taking these steps to avoid a public debt default, we would suggest these economies are now poised for more private debt defaults.
“We believe private investors do not yet get this connection, but it will be made very clear in the months ahead. Latvia, with a GDP collapse of nearly 25%, will become the next poster child of the region in this regard.”
Saturday, March 6, 2010
Who Determines Prices
There is a fire brewing in Europe these days. In fact, the fire has been brewing for quite a while. It jus so happens that those who never feel or see the fire are the one proposing solutions. I’m specifically referring to those in the financial policymaking world. Let’s take the example of Greece. Consider some financial facts, as reported by the Financial Times. We are told that the country:
When investors finally awoke from their “Rip Van Winkle” sleep, they began not only to sell the government bonds but also to buy insurance in case the country defaulted. This insurance comes in the form of what is call “credit default swaps” (CDS). In simple english, a CDS is a contract that gives its seller, in exchange for a periodic fee, the contractual obligation to cover the loss of the underlying asset should an agreed-upon-event occurs. For example, a company that owns Greek government debt can make a deal with another company: The former agrees to pay X amount on a periodic basis, in return the latter agrees to pay the loss if the underlying asset (i.e. Greek debt) does not perform well.
What has begotten headlines lately is the so call “naked” buyers. No, this does not mean a trader is naked when he buys a CDS. On the contrary, the folks who trade in the swaps market are paid handsomely enough to fly to Milan to have their suits tailor-made. In any event, the practice of “naked” buying refers to those firms who buy CDS [i.e. insurance] without owning the underlying Greek debt. The logic goes that these individuals have a vested interest in seeing the government default because it means huge payouts. In other words, they benefit from the continued deterioration of the country’s finances and by extension the social unrest that inevitably happens. Of course, Greek politicians and international technocrats who have little understanding of how markets work latch on this issue as if it were the progenitor of the mess that is currently happening.
I will not enter into a missive about the morality, if you will, of CDS. In fact, there is nothing immoral about it. It is absolutely satisfactory whenever individuals, acting in a voluntary manner, come to whatever agreement they deem to be in their best interest. Government’s only role here would be to enforce the contractual obligation. The exponential growth of the CDS market, and derivatives in general, has been the result of an excessively loose monetary policy. Therefore, without completely exonerating financial firms, ultimately central bank officials are responsible for pumping this bubble.
Having digressed for a bit. The heart of the issue here is the misunderstanding of the law of supply and demand in determining prices. It doesn’t matter what politicians or other policymakers believe. This law is as solid as the law of gravity. In laymen terms, the law states that at any price higher than equilibrium, sellers are stuck with too much inventory and therefore must decrease prices to get rid of it. Sellers prefer a loss that is above zero. In other words, a seller will always prefer to sell something, say, at $10, which might have caused the individual to loose, say, $20; but this is always preferable to any loss exceeding $20. Conversely, at a price below equilibrium, there are more buyers than available supply. In this instance, prices must increase. The right price will be that which buyers and sellers mutually agree upon. That said, it is important to note that prices are ultimately contingent upon consumer behavior. This is the key insight, yet often overlooked and misunderstood by policymakers, into the supply/demand analysis.
Let me say it another way, always and everywhere consumers determine prices. In the case of “naked” buyers of Greek government CDS, they are essentially betting that the underlying asset will loose value. Said differently, these traders believe that prices are too high and therefore must fall. However, they have no firepower to influence the fall of prices, if in fact it does happen. What causes prices to fall is when consumers of Greek government debt (i.e. those who bought its debt) no longer believe it is worth holding the financial asset. Therefore, they sell. The seller may bid a price lower than what the consumer offered. The latter has an option: accept or do not accept. The other option is to buy insurance, i.e. buy CDS. In any event, the consequences are obvious. It’s that simple.
It is worth repeating the corollary of the law of supply and demand: consumers determine prices, not sellers. Speculators have no direct influence beyond proving market price information to other segments of the sector.
"accounts for only 2 per cent of European gross domestic product. It has been in default for more than half of its history since 1832, running an average fiscal deficit of 7.8 per cent of gross domestic product since 1988.""There has been a centre-right government, until recently, which increased the government's share of GDP from 44 per cent to 52 per cent. The public sector is so inefficient that the cost of public administration is 7 per cent of GDP compared with an average of 3 per cent for the eurozone."
When investors finally awoke from their “Rip Van Winkle” sleep, they began not only to sell the government bonds but also to buy insurance in case the country defaulted. This insurance comes in the form of what is call “credit default swaps” (CDS). In simple english, a CDS is a contract that gives its seller, in exchange for a periodic fee, the contractual obligation to cover the loss of the underlying asset should an agreed-upon-event occurs. For example, a company that owns Greek government debt can make a deal with another company: The former agrees to pay X amount on a periodic basis, in return the latter agrees to pay the loss if the underlying asset (i.e. Greek debt) does not perform well.
What has begotten headlines lately is the so call “naked” buyers. No, this does not mean a trader is naked when he buys a CDS. On the contrary, the folks who trade in the swaps market are paid handsomely enough to fly to Milan to have their suits tailor-made. In any event, the practice of “naked” buying refers to those firms who buy CDS [i.e. insurance] without owning the underlying Greek debt. The logic goes that these individuals have a vested interest in seeing the government default because it means huge payouts. In other words, they benefit from the continued deterioration of the country’s finances and by extension the social unrest that inevitably happens. Of course, Greek politicians and international technocrats who have little understanding of how markets work latch on this issue as if it were the progenitor of the mess that is currently happening.
I will not enter into a missive about the morality, if you will, of CDS. In fact, there is nothing immoral about it. It is absolutely satisfactory whenever individuals, acting in a voluntary manner, come to whatever agreement they deem to be in their best interest. Government’s only role here would be to enforce the contractual obligation. The exponential growth of the CDS market, and derivatives in general, has been the result of an excessively loose monetary policy. Therefore, without completely exonerating financial firms, ultimately central bank officials are responsible for pumping this bubble.
Having digressed for a bit. The heart of the issue here is the misunderstanding of the law of supply and demand in determining prices. It doesn’t matter what politicians or other policymakers believe. This law is as solid as the law of gravity. In laymen terms, the law states that at any price higher than equilibrium, sellers are stuck with too much inventory and therefore must decrease prices to get rid of it. Sellers prefer a loss that is above zero. In other words, a seller will always prefer to sell something, say, at $10, which might have caused the individual to loose, say, $20; but this is always preferable to any loss exceeding $20. Conversely, at a price below equilibrium, there are more buyers than available supply. In this instance, prices must increase. The right price will be that which buyers and sellers mutually agree upon. That said, it is important to note that prices are ultimately contingent upon consumer behavior. This is the key insight, yet often overlooked and misunderstood by policymakers, into the supply/demand analysis.
Let me say it another way, always and everywhere consumers determine prices. In the case of “naked” buyers of Greek government CDS, they are essentially betting that the underlying asset will loose value. Said differently, these traders believe that prices are too high and therefore must fall. However, they have no firepower to influence the fall of prices, if in fact it does happen. What causes prices to fall is when consumers of Greek government debt (i.e. those who bought its debt) no longer believe it is worth holding the financial asset. Therefore, they sell. The seller may bid a price lower than what the consumer offered. The latter has an option: accept or do not accept. The other option is to buy insurance, i.e. buy CDS. In any event, the consequences are obvious. It’s that simple.
It is worth repeating the corollary of the law of supply and demand: consumers determine prices, not sellers. Speculators have no direct influence beyond proving market price information to other segments of the sector.
Wednesday, March 3, 2010
Interest Costs on the U.S. Federal Debt
Today’s graph comes courtesy of the Congressional Budget Office’s (CBO) The Budget and Economic Outlook, which was recently published [Note: graph is not well visible in this web page; click on the previous linked word, which will take you to the report. The graph is on page 1.] It shows the “past, present, and future” debt held by the public and the interest cost incurred by the Federal Government. The line denotes the amount of debt held by the public, which is measured by looking at the right-hand scale of the graph; the bars measure the interest rate costs, which is measure by the left-hand scale of the graph.
 As can be noted, the costs over the last year declined, despite a ballooning debt. This was the result of lower interest rates and lower costs incurred from the issuance of inflation-adjusted debt. In fact, the CBO noted that interest payments declined by almost 26% ($65 billion) from 2008 to 2009. However, they project that this cost will more than triple over the next 10 years.
One must always take such forecasts with a grain of salt. I believe they will almost certainly be wrong. The actual numbers will be worse than what the CBO projects. History has proven this. I recall reading one of their reports in 1999. They claim that over the next 10 years (then) the U.S. would have paid down its debt. Of course, as it turned out they were a tiny bit off! Rest assured the same will repeat this time around.
Higher interest rates are surely on the horizon. There will come a point in time that U.S. debt buyers will recognize the true credit risk of holding Treasuries. They will demand higher yields. Consequently, this will put an additional burden on the fiscal position of the country. Unless the country truly puts its fiscal reigns on, this is pretty much a foregone conclusion.
As can be noted, the costs over the last year declined, despite a ballooning debt. This was the result of lower interest rates and lower costs incurred from the issuance of inflation-adjusted debt. In fact, the CBO noted that interest payments declined by almost 26% ($65 billion) from 2008 to 2009. However, they project that this cost will more than triple over the next 10 years.One must always take such forecasts with a grain of salt. I believe they will almost certainly be wrong. The actual numbers will be worse than what the CBO projects. History has proven this. I recall reading one of their reports in 1999. They claim that over the next 10 years (then) the U.S. would have paid down its debt. Of course, as it turned out they were a tiny bit off! Rest assured the same will repeat this time around.
Higher interest rates are surely on the horizon. There will come a point in time that U.S. debt buyers will recognize the true credit risk of holding Treasuries. They will demand higher yields. Consequently, this will put an additional burden on the fiscal position of the country. Unless the country truly puts its fiscal reigns on, this is pretty much a foregone conclusion.
Tuesday, March 2, 2010
Federal Reserve Market Intervention & Its Effects
Make no mistake, while difficult to ascertain the extent and longevity on the outcome, all Federal Reserve interventions affect the markets. The schemes that the FED has employed over the last 18+ months are unique in American history. Frankly, there is no precedent for what they have done. Below is a list of direct market interventions, including the purchases of bonds [Note: the data for this post was obtained from a recent paper published by the OECD and the Federal Reserve Board website.]
1. Asset-Backed Commercial Paper Money Market Fund Liquidity Facility (AMLF): Provided funding to U.S. depository institutions and bank holding companies to finance their purchases of high-quality asset-backed commercial paper (ABCP) from money market mutual funds under certain conditions. The AMLF began operations on September 22, 2008, and was closed on February 1, 2010.
2. Commercial Paper Funding Facility (CPFF): The purpose of the CPFF is to enhance the liquidity of the commercial paper market by increasing the availability of term commercial paper funding to issuers and by providing greater assurance to both issuers and investors that firms will be able to roll over their maturing commercial paper.
3. Money Market Investor Funding Facility (MMIFF): was designed to provide liquidity to U.S. money market investors. Under the MMIFF, the Federal Reserve Bank of New York could provide senior secured funding to a series of special purpose vehicles to facilitate an industry-supported private-sector initiative to finance the purchase of eligible assets from eligible investors. The MMIFF was announced on October 21, 2008, and expired on October 30, 2009.
4. Central Bank Liquidity Swaps: The Federal Reserve entered into agreements to establish temporary reciprocal currency arrangements (central bank liquidity swap lines) with a number of foreign central banks. Two types of temporary swap lines were established: dollar liquidity lines and foreign-currency liquidity lines. The former supplied dollars to foreign central banks while the latter foreign central banks supplied foreign currency to the FED. These temporary arrangements expired on February 1, 2010.
5. Term Auction Facilities (TAF): Under the TAF program, the Federal Reserve auctions term funds to depository institutions. Through the end of 2009, the TAF program made available funds of 28-day and 84-day maturity, at an interest rate that is determined by the auction. On January 27, 2010, the Federal Reserve announced that the final TAF auction will be conducted on March 8, 2010. Term auction credit outstanding is reported in tables 1, 10, and 11 of the H.4.1 statistical release.
6. Primary Dealer Credit Facility (PDCF): Provides loans of cash and securities to primary dealers, the securities broker-dealers that have a trading relationship with the Federal Reserve Bank of New York. These programs were closed on February 1, 2010. PDCF credit was fully secured by collateral with appropriate haircuts--that is, the value of the collateral exceeded the value of the loan extended.
7. Securities Lending: The FED provided securities loans to primary dealers based on a competitive auction for overnight loans against other Treasury securities as collateral. Securities lent on an overnight basis through this facility are presented in table 1A of the H.4.1 statistical release.
8. Term Securities Lending Facility (TSLF): The TSLF loaned Treasury securities to primary dealers for one month against eligible collateral. The TSLF was closed on February 1, 2010.
9. The Term Securities Lending Facility Options Program (TOP): offered an option to primary dealers to draw upon short-term, fixed rate TSLF loans from the System Open Market Account portfolio in exchange for eligible collateral. Effective July 1, 2009, TOP auctions were suspended and were not resumed before the TSLF program was closed on February 1, 2010.
10. Term Asset-Backed Securities Loan Facility (TALF): The TALF is a funding facility that issues loans with a term of up to five years to holders of eligible asset-backed securities (ABS). On fixed days each month, borrowers will be able to request one or more three-year or, in certain cases, five-year TALF loans. Loan proceeds will be disbursed to the borrower, contingent on receipt by the New York Fed’s custodian bank (custodian) of the eligible collateral, an administrative fee, and margin, if applicable. As the loan is non-recourse, if the borrower does not repay the loan, the New York Fed will enforce its rights in the collateral and sell the collateral to a special purpose vehicle (SPV) established specifically for the purpose of managing such assets. Lending through the TALF is presented in table 1 of the H.4.1 statistical release and is included in "Other loans" in tables 10 and 11. The Federal Reserve Board has authorized extensions of credit through the TALF until June 30, 2010, for loans collateralized by newly issued commercial mortgage-backed securities (CMBS) and through March 31, 2010, for loans collateralized by all other TALF-eligible securities.
11. The agency MBS program will involve the outright purchase of a total of $1.25 trillion in agency MBS by the investment managers on behalf of the Federal Reserve by the end of the first quarter of 2010.
12. Purchased $300 billion longer-dated Treasury Securities (mainly 2-10 year). Completed by the end of October 2009.
13. Purchase about $175 billion in GSE direct obligations, which will be in place through the end of the first quarter of 2010.
Effects of Market Interventions
Although quantifying the effects of asset purchases by central banks remains challenging, the New York Fed has estimated that large-scale asset purchase programs conducted by the Fed taken together (totalling $1.8 trillion) have reduced the 10-year government bond yield as much as 50 basis points.
3-Month LIBOR-OIS
 Interbank Lending Rates

In the mortgage-backed security market in the United States, for instance, the Fed has been the predominant buyer since the introduction of the direct purchase scheme with its acquisition to date exceeding 50% of the total volume of new issuance in 2009.
Conventional Mortgage Rate (30 yrs) – Treasury benchmark bond yield (30 years) = Mortgage spread
 Potential Risks
1. Distortionary effects on asset prices may weaken economic performance.
2. Inefficient allocation of money across the financial sector.
3. Unconventional measures if maintained too long can destabilize inflation expectations and induce inflationary pressures.
Monday, March 1, 2010
Irrational Monetary Policy
This is what Dr. Marc Faber aptly expresses in this video.
He clearly explains what got us into this economic mess. It is certainly worth the watch [note: video is 5 minutes 12 seconds.]
He clearly explains what got us into this economic mess. It is certainly worth the watch [note: video is 5 minutes 12 seconds.]
Subscribe to:
Posts (Atom)


