[Blogger's Note: A timely commentary by Financial Times analyst, Gillian Tett regarding the swaps market anomaly that recently arose; namely, swap rates trading below treasury rates in the 10-year tenor bucket. It is certainly worth the read. I share her comments.]
********************************************************
By Gillian Tett
Published: March 29 2010 (Financial Times)
In recent years, a key axiom that every investment manager learnt at school (or, more accurately, in an MBA class) was that the rate at which triple A-rated countries such as America could borrow money could be labelled the “risk-free” rate – and corporate (and) other borrowing costs could be measured against it.
But is it time to rethink that “risk-free” tag? If you look at what is happening in the US and UK interest rate markets right now, the answer is “yes”. From time immemorial, it has been taken as self-evident that the swaps spread in debt markets should be “positive”. What this so-called “swaps spread” essentially measures is the cost of borrowing funds in the Libor market (for a private companies, such as banks), minus the cost of raising government debt.
And, since the private borrowing costs are influenced by credit and counterparty issues (ie: whether banks default or fail to repay), logic suggests those Libor rates should be higher than sovereign borrowing rates.
After all, triple A-rated central government is supposed to the safest thing about. But now, as my colleagues Michael Mackenzie and David Oakley first reported two weeks ago, something bizarre is going on. Back in late 2008, after the collapse of Lehman Brothers, the 30-year swap spread turned negative, when the markets froze amid wider financial chaos.
At the time, that swing did not grab many headlines, partly because the 30-year market garners little attention in the US. However, last week the closely watched – and vastly more influential – benchmark 10-year swap spread turned negative too, as 10-year Treasury yields spiralled up towards 4 per cent and above the 10-year swap rate.
That may simply be a temporary aberration. After all, the swaps market is not a perfect barometer of macroeconomic conditions and some unusual supply-demand imbalances seem to be distorting the market.
One issue affecting spreads, for example, is that investors are changing the way that they hedge mortgage rate risk, since the Federal Reserve is due to stop buying mortgage backed securities on Tuesday. A second factor is that more pension funds are trying to use swaps for meeting long-dated liabilities, rather than commit capital to buying bonds, at a time when government bonds are losing their scarcity value because of massive issuance.
At the same time, a flood of corporate issuance has left an unusually high number of entities swapping their fixed liabilities for floating exposures. More importantly still, there are rumours that some banks and hedge funds have recently suffered losses because they were wrong-footed by the swap swing. If so, they may be trying to cut their positions, thus exacerbating market movements.
However, there is another, less benign explanation for what is going on: namely that what we are seeing is a “canary in the coal mine” (to use the pithy image used by Alan Greenspan, former Fed chairman, last week), heralding future government bond market trouble and investor panic.
Think back, for a moment, to the early summer of 2007, or just before the start of the subprime meltdown. Back then, it was not the equity and credit markets that signalled disaster. Instead, the main sign of spreading investor alarm was that prices started to swing in the more obscure world of credit derivatives indices (such as ABX) and asset-backed commercial paper (ABCP).
This time round, is the swaps market another version of, say, ABX? Perhaps not yet. Personally, I will be astonished if countries such as the UK and US entirely avoid a government bond market shock; but I also suspect that this will occur some time down the road.
Nevertheless, if nothing else, the swaps spread swing does suggest that some investors are getting jittery. It also serves to underline that we do not live in “normal” markets right now. While the surface may look calm, the inner cogs of the financial system have been distorted by government intervention in ways that are still barely understood.
That, coupled with spiralling levels of government debt, has the potential to cause all manner of investment assumptions to go awry. Some trading desks and hedge funds are probably already counting the cost of that; as I noted above, the swaps spread swing has almost certainly created losses somewhere, given that it was not factored into most trading models.
But the story is unlikely to stop there. If we are moving into a world where government debt is no longer automatically deemed “risk-free”, partly because it no longer has any scarcity value, this will be a different world to the one investors know. In the months ahead, in other words, investors and politicians had better keep watching this swaps “canary”. Especially (but not exclusively) in the ever-expanding Treasuries world.
Tuesday, March 30, 2010
Monday, March 29, 2010
The Irrelevance of ObamaCare
Much has been said about the recent passage of the so-called ObamaCare. What hasn’t been said is that it is pretty much irrelevant in term of fiscal possibility. Sure, through budget gymnastics the powers-that-be were able to convey that “free healthcare” is not only affordable but also free. No, not free in the sense that partakers will not have to fork out anything when visiting a doctor, but free in the sense that it won’t add to the government deficit. Right! It will be anything but that. Since politicians can rarely do simple arithmetic, I’ll do it on their behalf. Consider the following:
1. Unfunded liabilities of Social Security, Medicaid, and Medicare are approximately $100 trillion (yes, trillions; it is not a typo). This was estimated by the Federal Reserve Bank of Dallas. [See Here]. And as my previous post reported, Social Security will pay out more this year than it will receive.
2. The federal government debt is currently $12.6 trillion. [See Here]
3. The federal government will add about an extra $9 trillion over the next decade. [See Here]
On a second thought, you do the math.
Against this backdrop, ObamaCare and all other government promises are a pipe dream. I dare say at least 80% of the population (using Pareto's Law) are in the dark about the economic standing of our nation. Only when it is too late they will understand.
Social Security Insanity
By Addison Wiggin
03/29/10 Baltimore, Maryland – Wanted: Accountants to oversee government fund. Employer seeks relative accuracy, margin of error +/-30%. GED preferred. Optimism required. Candidates to be compensated at market value plus $50,000. No calls please.
The Congressional Budget Office now predicts the Social Security fund will pay out more than it earns starting this year – as in it’s happening right now.
That’s just a shade off of last year’s forecast, which expected the fund to run a deficit starting in late 2016. And a far cry from the CBO data we used while making I.O.U.S.A. in 2007 and 2008.
 And as you can see, the fund is not just dipping its toes in deficit waters. The current forecast reveals a torrential drop from $20 billion surplus to $29 billion shortfall since we premiered the film on Aug., 22, 2008 – before we knew who the current president would be… and, more importantly, before Lehman Bros. crumbled.
Surely, some sort of unpredictable catastrophe precedes such a revision… something that wasn’t even on the national radar in 2009:
“The problem,” The New York Times helpfully suggests, “is that payments have risen more than expected during the downturn, because jobs disappeared and people applied for benefits sooner than they had planned. At the same time, the program’s revenue has fallen sharply, because there are fewer paychecks to tax.”
Really. Who could have seen that coming?
03/29/10 Baltimore, Maryland – Wanted: Accountants to oversee government fund. Employer seeks relative accuracy, margin of error +/-30%. GED preferred. Optimism required. Candidates to be compensated at market value plus $50,000. No calls please.
The Congressional Budget Office now predicts the Social Security fund will pay out more than it earns starting this year – as in it’s happening right now.
That’s just a shade off of last year’s forecast, which expected the fund to run a deficit starting in late 2016. And a far cry from the CBO data we used while making I.O.U.S.A. in 2007 and 2008.
And as you can see, the fund is not just dipping its toes in deficit waters. The current forecast reveals a torrential drop from $20 billion surplus to $29 billion shortfall since we premiered the film on Aug., 22, 2008 – before we knew who the current president would be… and, more importantly, before Lehman Bros. crumbled.Surely, some sort of unpredictable catastrophe precedes such a revision… something that wasn’t even on the national radar in 2009:
“The problem,” The New York Times helpfully suggests, “is that payments have risen more than expected during the downturn, because jobs disappeared and people applied for benefits sooner than they had planned. At the same time, the program’s revenue has fallen sharply, because there are fewer paychecks to tax.”
Really. Who could have seen that coming?
Saturday, March 27, 2010
Swap Rates vs. Treasury Rates
Following on my previous post regarding swap rates falling below treasury rates, this is a phenonon not only evident in the U.S. market but also in the UK. In Europe, the relationship is “normal.” Read the following excerpt below from a report published in today’s FT.
For the first time since swaps emerged in the mid-1980s, the 10-year swap rate traded below that of the "risk free" 10-year Treasury yield. Analysts say this reflects how government debt issuance has altered the dynamics between "risk-free" yields and swaps, which reflect borrowing costs for non-sovereign borrowers.
In the UK, swap rates have been below those of 10-year gilt yields since January. The yield on 10-year gilts was at 4.03 per cent yesterday, up from a low of 3.91 per cent earlier this week. The peak yield so far this year was 4.27 per cent in February. In Europe, however, swap rates are 20 basis points higher than 10-year yields.
"If we get clarity on what the UK will do on deficit reduction once the election is behind us, then the market and gilt yields could stabilise," says Mike Amey, UK portfolio manager for Pimco. Since the UK budget on Wednesday, the negative spread, or inversion, has widened with swap rates trading nearly 20 basis points below gilts for 10-year maturities compared with a negative spread of 10bps just before the government statement on public finances.
In other words, huge issuance is already creating unexpected distortions and stresses in the market. It is far from clear that we have seen the last of them, given the amounts that still need to be raised.
Loosing Ground: U.S. Treasurys
Signaling the difficulties ahead for the U.S. government debt market, another historic moment occurred this week: the 10-year swap rates falling below the 10-year Treasury yield (see the Financial Times report below). Since the swaps market’s inception, this had never happen. Swap rates should be trading above Treasury rates simply because the risk characteristics of the latter are less vis-à-vis the former. Swap rates, in layman terms, provide a reference into what the borrowing costs of a non-government borrower would be. Treasury rates are the anchor known as the “risk-free” rate used in many cash flow discounting scenario analysis. What can be said about such analysis when an alternate, yet imperfect substitute, risk-free interest rate moves higher? The answer: misleading. Fundamentally, this is why capital markets all around are significantly overvalued.
=======================================
Flight from Treasuries to swaps increases
By Michael Mackenzie in New York
Published: March 25 2010 (Financial Times)
Tuesday's historic inversion between US swap rates and 10-year Treasury yields intensified yesterday, as traders were forced to cut loss-making positions and investors dumped cash bonds in favour of derivatives ahead of the ending of the first quarter next week.
At the peak of the selling pressure yesterday, swap rates fell nearly 10 basis points below the yield on US Treasuries. On Tuesday, the swap rate closed 2bp below Treasury yields, the first time since swaps emerged in the 1980s that there has been an inversion between triple A rated Treasuries and lower-rated money market rates.
Falling swap rates coincided with the yield on 10-year Treasury notes jumping to 3.85 per cent from 3.70 per cent, as loss-making trades between swaps and government paper were cut by traders. The rate for seven-year swaps also fell below that of seven-year Treasury yields for the first time yesterday.
Swap rates typically trade at a premium to Treasury yields as their funding cost, Libor, is higher than that of "risk free" Treasuries. However, heavy Treasury debt issuance has helped drive the recent inversion. Analysts say that the proximity of quarter-end was another driver of inversion as investors do not want to hold cash bonds on balance sheets and would rather use swaps, which are off-balance instruments.
"This is a combination of corporate issuance and the fact that swaps are less balance-sheet intensive than Treasuries ahead of the quarter-end," said Ales Li, strategist at Credit Suisse.
Swap rates have slowly narrowed against the backdrop of record government debt issuance after trading 60bp above Treasuries in 2008.
Analysts say the inversion may hold for some time as investors stretch for yield beyond Treasuries, as they need to invest this year's strong inflows into bond funds from money market funds.
"The rate is a signal that the market has a huge appetite for alternative spread product to Treasuries," said Brian Yelvington, strategist at Knight Libertas Research.
Friday, March 26, 2010
Debtor Nation
by James Turk
Only a few decades ago, the United States was the world's largest creditor nation. American capital spanned the globe financing all types of investments in virtually every country. But that dominance began to erode in the 1960s because growth in consumption in the United States was starting to outpace new production. Wealth built up over generations was being consumed.
To compensate for the resulting decline in living standards, the nation turned to debt, rather than hard work and savings. This trend continued through the next decade. A focus on consumption and a seemingly unstoppable reliance on debt at all levels of American society had become the dominant force in economic activity.
By the 1980s, the inevitable happened. As generations of accumulated wealth disappeared, a line was crossed. America now owed more to the rest of the world than the world owed to it. The United States had become a debtor nation, and it has continued to run up the tab in the decades since.
The mindset of policymakers today continues to be one of debt and consumption instead of savings, investment and production. We see this way of thinking in their pronouncements and actions. Worryingly, the tipping point appears to have been reached. Not only is the United States living beyond its means, it is now borrowing beyond its means, as graphically illustrated in the following chart prepared by Nathan Martin.
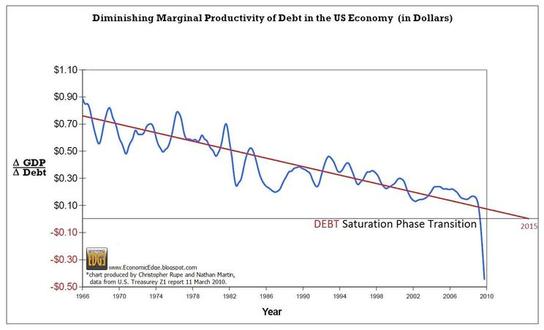
Here's is how Mr. Martin explains the crucial message from this chart.
As I see it, a lot of the federal government's promises are about to be broken. The collapse of the once almighty dollar is rapidly approaching.
Only a few decades ago, the United States was the world's largest creditor nation. American capital spanned the globe financing all types of investments in virtually every country. But that dominance began to erode in the 1960s because growth in consumption in the United States was starting to outpace new production. Wealth built up over generations was being consumed.
To compensate for the resulting decline in living standards, the nation turned to debt, rather than hard work and savings. This trend continued through the next decade. A focus on consumption and a seemingly unstoppable reliance on debt at all levels of American society had become the dominant force in economic activity.
By the 1980s, the inevitable happened. As generations of accumulated wealth disappeared, a line was crossed. America now owed more to the rest of the world than the world owed to it. The United States had become a debtor nation, and it has continued to run up the tab in the decades since.
The mindset of policymakers today continues to be one of debt and consumption instead of savings, investment and production. We see this way of thinking in their pronouncements and actions. Worryingly, the tipping point appears to have been reached. Not only is the United States living beyond its means, it is now borrowing beyond its means, as graphically illustrated in the following chart prepared by Nathan Martin.
Here's is how Mr. Martin explains the crucial message from this chart.
"This is a very simple chart. It takes the change in GDP and divides it by the change in Debt. What it shows is how much productivity is gained by infusing $1 of debt into our debt backed money system.
Back in the early 1960s a dollar of new debt added almost a dollar to the nation's output of goods and services. As more debt enters the system the productivity gained by new debt diminishes…[but now] total income can no longer support total debt. In the third quarter of 2009 each dollar of debt added produced NEGATIVE 15 cents of productivity, and at the end of 2009, each dollar of new debt now SUBTRACTS 45 cents from GDP!"
The US is digging itself into a hole, and if the message in the above chart was not clear enough, another bell tolled last week. Moody's warned that the triple-A credit rating of the United States is at risk of being downgraded if the nation fails to come to grips with its growing debt. It warned:"Preserving debt affordability at levels consistent with Aaa ratings will invariably require fiscal adjustments of a magnitude that, in some cases, will test social cohesion." [Emphasis added]
It is an unusually stark assessment with profound implications that require thoughtful attention. Debt has always been and will always be a two-edged sword. Iceland now knows that lesson well. So do Dubai and Greece. Other nations – including the United States – are about to learn that lesson too.As I see it, a lot of the federal government's promises are about to be broken. The collapse of the once almighty dollar is rapidly approaching.
Housing Woes: Single-Family Home Prices
[Thanks to www.chartoftheday.com]
For some perspective into the all-important US real estate market, today's chart illustrates the US median price of a single-family home over the past 40 years. Not only did housing prices increase at a rapid rate from 1991 to 2005, the rate at which housing prices increased -- increased. That brings us to today's chart which illustrates how housing prices have dropped 35% from the 2005 peak. In fact, a home buyer who bought the median priced single-family home at the 1979 peak has actually seen that home lose value (4.3% loss). Not an impressive performance considering that over three decades have passed. It is worth noting that the median priced home has moved back to the top of a trading range that existed from the late 1970s into the mid-1990s.

For some perspective into the all-important US real estate market, today's chart illustrates the US median price of a single-family home over the past 40 years. Not only did housing prices increase at a rapid rate from 1991 to 2005, the rate at which housing prices increased -- increased. That brings us to today's chart which illustrates how housing prices have dropped 35% from the 2005 peak. In fact, a home buyer who bought the median priced single-family home at the 1979 peak has actually seen that home lose value (4.3% loss). Not an impressive performance considering that over three decades have passed. It is worth noting that the median priced home has moved back to the top of a trading range that existed from the late 1970s into the mid-1990s.
Subscribe to:
Posts (Atom)


