Monday, July 4, 2022

What’s Up and Down with Japan’s Economy

This post is simply to provide a brief explanation of what is currently happening with the Japanese economy.  As recent news have explained, there has been tremendous pressure in the Yen, which has caused it to depreciate relative to the US Dollar. For example, on January 1, 2022, you needed to pay about 115 Yen to purchase $1; and as of July 4, 2022, you now need approximately 135 Yen to purchase the same $1. This means that so far this year the Yen has lost about 17.4% in value relative to the Dollar.  At a basic level, the loss in value has to do with supply and demand issues: people are selling the Yen and buying US Dollars.

Why are people selling the Yen? Because investors have determined there are better returns in an alternative currency (i.e US Dollars). And right now, in terms of investment returns, the US provides an appealing opportunity. Japanese bonds (10-years) are currently paying somewhere in the neighborhood of 23 basis points – about 2.5% less when compared with similar US bonds. Furthermore, with consumer price inflation running hot and as a result the US Central Bank has begun to increase rates, this means that from an investment perspective US bonds are increasing their appeal. As such, people sell bonds and buy US treasuries – which essentially means selling Yen and buying Dollars.

This puts additional downward pressure in Japan for the demand of their bonds. This causes bond prices to fall, thereby increasing yields. On top of this market phenomenon, as part of its monetary policy, the Central Bank of Japan is committed to maintaining a maximum of 25 basis points for its 10-year debt. But as the bond selling pressure increases, the BOJ is doing what they can to assure that interest rates do not exceed the central bank policy target rate of 25 basis points. This means that any excess supply of debt, the BOJ is buying. And when the BOJ buys, it is increasing the money supply, which devalues the currency. It is becoming a pernicious cycle.

How long with the BOJ continue to do this? We don’t know for sure. What we do know with fair certainty is that what the BOJ is doing is not sustainable. Judging from prior history (see Asian Crisis of 1997-1998 to get a sense of what could unfold), we know that this will not end well.

Monday, February 14, 2022

What is the US Treasury Yield Curve saying?

Yield curve inversion occurs when short-term rates are higher than the long-term rates. Historically, this has been a predictor of recessions, which it is normally witnessed within a year after the inversion occurs.

Banks typically make money when borrowing money at the short end of the yield-curve and lending at longer end of the curve. In other words, they borrow at a lower rate than what they lend, netting the difference. An inverted yield curve is generally not good news for banks. 

At the moment, based on the yield curve rates reported on February 14, 2022, I do not see evidence of an inverted yield curve when measuring the difference between the 30-year rate and the 3-month rate. 

Saturday, February 12, 2022

What are US Treasury interest rates telling us?

The short answer is a mixed one. 

Let’s take a look at the 2-year Treasury yield from February 11, 2021 and compare it to its yield noted for the latest available data as of February 11, 2022. Last February’s yield stood at 0.11% and it now stands at 1.50%. Based on those numbers, we can say that the upward pressure in rates could come from the inflation premium. 

However, when we look at the longer-end of the yield curve, namely the 30-year bond, we get a different picture. On February 11, 2021 the 30-year yield stood at 1.94%, and it now stands at 2.24%. In addition, the yield was essentially flat during this week – one in which inflation fear spiked after the printed CPI stood at 7.48%.  This tells us that inflation risk has not yet gotten out of hand. It tells us that market participants still believe that the Federal Reserve will succeed in taming the increases in prices. 

Pay attention to the 30-year bond. It will give you a pulse of what the market really things about inflation risk.  

Thursday, February 10, 2022

Median CPI for January 2022: Worsening Trend

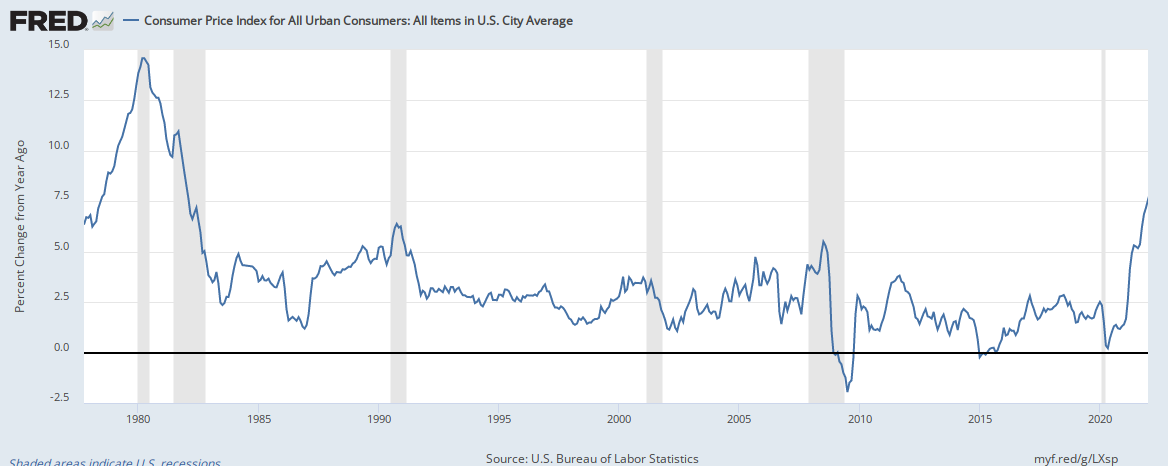
Today’s headline CPI for the month of January 2022 was reported to be at 7.48%, the highest it’s been over the last decade. In fact, you would have to back to 1982 to find a similar figure. This is what the headline CPI looks like since 1980:


But in order to get a real sense of what is happening in the inflation front, we have to look under the hood. The median CPI gives us that measure. Aggregates measures are inherently imprecise, because it is trying to capture the average consumer, but in doing so it will by nature miss what is happening on a person-by-person basis. At any rate, we need something as a measurement tool. This is what the median CPI (orange line) looks like when compared with other cuts of the CPI:


The trend is obvious. It is upward. It is not letting up. 

Are supply chains the main contributor to this rise? Is the loose monetary policy the culprit? I think both. It looks like the Federal Reserve Bank will be pressured to raise interest rates quicker and perhaps in greater amounts than initially forecast.

Saturday, February 5, 2022

Money flowing out of risky investments: What does it mean?

Money flowing out of risky investments: What does it mean?

Money continues to flow out of the riskier side of bonds. Take a look at this chart: 

As can be seen, the amount of money being pulled out from US high yield bonds has been on a downward trend for the last four months. This has not happened over the last year.

What does this mean? For one, the dumping of riskier debt means that investors are growing risk-averse and putting money in safer investments. More broadly, the movement away from high yield bonds could mean that market expectations are shifting towards safety, as general market risk continues to increase. Will the trend reverse? Only time will tell.

Saturday, January 29, 2022

Inflation has not reared its ugly head…yet!

This week the Federal Open Market Committee (FOMC), the arm of the Federal Reserve that conducts monetary policy, noted that “[w]ith inflation well above 2 percent and a strong labor market, the Committee expects it will soon be appropriate to raise the target range for the federal funds rate.”

During the Press Conference, FOMC’s Chairmen Jerome Powell noted that their aim is not to allow inflation to be entrenched. What he meant by that was that the FOMC does not want higher inflation to be the expected norm. Why? Because once inflation gets unanchored, it is difficult to bring it back under control. 

Although certainly inflation risk is evident, it is not yet entrenched in market expectations. One measure we can look into is to see what has been the trajectory of the 30-year Treasury bond. Long-term fixed income securities are the most sensitive to higher inflation premiums. When the inflation premium increases, the bond yield increases. Conversely, when the premium is stable or low, the bond yield will be relatively flat or declining. The Treasury bond is supposed to the “risk-free” benchmark, therefore, inflation risk would show up in this market. 

This is the current chart of the 30-year Treasury bond since January 2021:

Data source: https://www.treasury.gov/resource-center/data-chart-center/interest-rates/pages/TextView.aspx?data=yieldYear&year=2022

As you can see, there is no entrenched expectation that higher inflation is on the horizon. In fact, based on the trajectory the market believes that any inflation we see now is contained and that there is no risk of it getting out hand. When yields are on a sustained increase, say above 3%, we should then seriously consider the risk of inflation rearing its ugly head. 

Saturday, January 22, 2022

Central Bankers’ concern that inflation will get out of hand

Catherine Mann, Bank of England policymaker, made the following statement that is indicative of the dilemma Central Bankers from G5 nations are deliberating:

“Going into 2022, current price and wage expectations coming from the monthly decision maker panel [a monthly business survey] are inconsistent with the 2 per cent target, and if they are realised in 2022 are likely to keep inflation strong for longer…It should be a concern that the costs from 2021 are becoming reflected in price expectations for 2022,” she said, adding: “Changing expectations is the first defence against a reinforcing wage-price dynamic.”

2% is the threshold that the most influential Central Banks in the world have adopted in order to manage their monetary policy in the context of maintaining a stable monetary system. When inflation is shoots above or below that threshold, it marks the point at which deliberations must take place to assure price remain stable. Unstable prices produce a lot of uncertainty, which hinders economic growth. When price are increasing at a faster pace than the expected 2% per annum, it means that the Central Bank must conduct monetary policy to the rate within the threshold range. 

However, when expectations from people get entrenched, especially when they look at the past in order to forecast the future, it becomes exceedingly difficult for Central Bankers to re-anchor those expectations. At this time, the market expects that Central Banks will reduce the money supply and be successful in reining in inflation. Why does the market believe this? Because it has worked in the past. The trouble would be if Central Banks fail in execution, which would then possibly lead people to lose faith in their ability to curtail inflation.