Saturday, February 12, 2022

What are US Treasury interest rates telling us?

The short answer is a mixed one. 

Let’s take a look at the 2-year Treasury yield from February 11, 2021 and compare it to its yield noted for the latest available data as of February 11, 2022. Last February’s yield stood at 0.11% and it now stands at 1.50%. Based on those numbers, we can say that the upward pressure in rates could come from the inflation premium. 

However, when we look at the longer-end of the yield curve, namely the 30-year bond, we get a different picture. On February 11, 2021 the 30-year yield stood at 1.94%, and it now stands at 2.24%. In addition, the yield was essentially flat during this week – one in which inflation fear spiked after the printed CPI stood at 7.48%.  This tells us that inflation risk has not yet gotten out of hand. It tells us that market participants still believe that the Federal Reserve will succeed in taming the increases in prices. 

Pay attention to the 30-year bond. It will give you a pulse of what the market really things about inflation risk.  

Thursday, February 10, 2022

Median CPI for January 2022: Worsening Trend

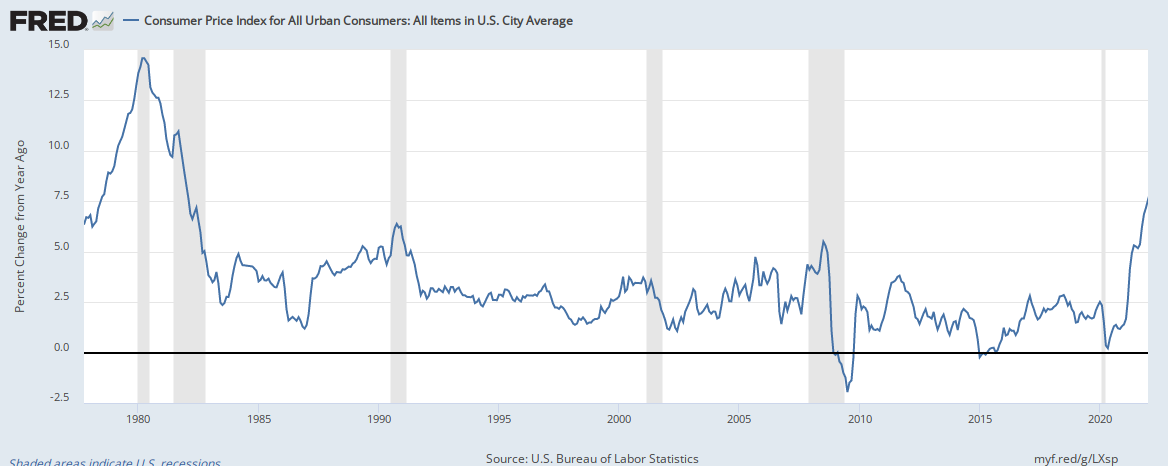
Today’s headline CPI for the month of January 2022 was reported to be at 7.48%, the highest it’s been over the last decade. In fact, you would have to back to 1982 to find a similar figure. This is what the headline CPI looks like since 1980:


But in order to get a real sense of what is happening in the inflation front, we have to look under the hood. The median CPI gives us that measure. Aggregates measures are inherently imprecise, because it is trying to capture the average consumer, but in doing so it will by nature miss what is happening on a person-by-person basis. At any rate, we need something as a measurement tool. This is what the median CPI (orange line) looks like when compared with other cuts of the CPI:


The trend is obvious. It is upward. It is not letting up. 

Are supply chains the main contributor to this rise? Is the loose monetary policy the culprit? I think both. It looks like the Federal Reserve Bank will be pressured to raise interest rates quicker and perhaps in greater amounts than initially forecast.

Saturday, February 5, 2022

Money flowing out of risky investments: What does it mean?

Money flowing out of risky investments: What does it mean?

Money continues to flow out of the riskier side of bonds. Take a look at this chart: 

As can be seen, the amount of money being pulled out from US high yield bonds has been on a downward trend for the last four months. This has not happened over the last year.

What does this mean? For one, the dumping of riskier debt means that investors are growing risk-averse and putting money in safer investments. More broadly, the movement away from high yield bonds could mean that market expectations are shifting towards safety, as general market risk continues to increase. Will the trend reverse? Only time will tell.

Saturday, January 29, 2022

Inflation has not reared its ugly head…yet!

This week the Federal Open Market Committee (FOMC), the arm of the Federal Reserve that conducts monetary policy, noted that “[w]ith inflation well above 2 percent and a strong labor market, the Committee expects it will soon be appropriate to raise the target range for the federal funds rate.”

During the Press Conference, FOMC’s Chairmen Jerome Powell noted that their aim is not to allow inflation to be entrenched. What he meant by that was that the FOMC does not want higher inflation to be the expected norm. Why? Because once inflation gets unanchored, it is difficult to bring it back under control. 

Although certainly inflation risk is evident, it is not yet entrenched in market expectations. One measure we can look into is to see what has been the trajectory of the 30-year Treasury bond. Long-term fixed income securities are the most sensitive to higher inflation premiums. When the inflation premium increases, the bond yield increases. Conversely, when the premium is stable or low, the bond yield will be relatively flat or declining. The Treasury bond is supposed to the “risk-free” benchmark, therefore, inflation risk would show up in this market. 

This is the current chart of the 30-year Treasury bond since January 2021:

Data source: https://www.treasury.gov/resource-center/data-chart-center/interest-rates/pages/TextView.aspx?data=yieldYear&year=2022

As you can see, there is no entrenched expectation that higher inflation is on the horizon. In fact, based on the trajectory the market believes that any inflation we see now is contained and that there is no risk of it getting out hand. When yields are on a sustained increase, say above 3%, we should then seriously consider the risk of inflation rearing its ugly head. 

Saturday, January 22, 2022

Central Bankers’ concern that inflation will get out of hand

Catherine Mann, Bank of England policymaker, made the following statement that is indicative of the dilemma Central Bankers from G5 nations are deliberating:

“Going into 2022, current price and wage expectations coming from the monthly decision maker panel [a monthly business survey] are inconsistent with the 2 per cent target, and if they are realised in 2022 are likely to keep inflation strong for longer…It should be a concern that the costs from 2021 are becoming reflected in price expectations for 2022,” she said, adding: “Changing expectations is the first defence against a reinforcing wage-price dynamic.”

2% is the threshold that the most influential Central Banks in the world have adopted in order to manage their monetary policy in the context of maintaining a stable monetary system. When inflation is shoots above or below that threshold, it marks the point at which deliberations must take place to assure price remain stable. Unstable prices produce a lot of uncertainty, which hinders economic growth. When price are increasing at a faster pace than the expected 2% per annum, it means that the Central Bank must conduct monetary policy to the rate within the threshold range. 

However, when expectations from people get entrenched, especially when they look at the past in order to forecast the future, it becomes exceedingly difficult for Central Bankers to re-anchor those expectations. At this time, the market expects that Central Banks will reduce the money supply and be successful in reining in inflation. Why does the market believe this? Because it has worked in the past. The trouble would be if Central Banks fail in execution, which would then possibly lead people to lose faith in their ability to curtail inflation.

Wednesday, January 19, 2022

Ballooning Fed’s Balance Sheet

When the Fed increases its balance sheet it means that money has been created and pumped into the banking system. The Fed does this when it believes the economy needs some jump-starting or support. When money is pumped into the economy, the Fed will buy securities from the banks (thereby increasing its securities holdings); conversely, when the Fed wants to reduce the amount of money in the market, they will sell securities to banks (thereby reducing its securities holdings).

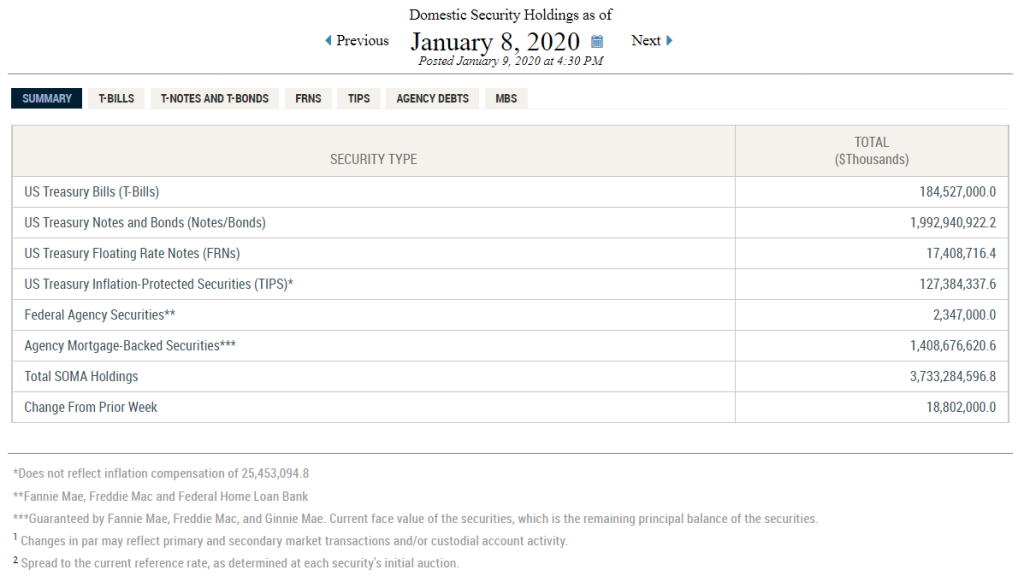
Since March 2020 the Fed has been increasing its balance in manner never seen before. Here is a quick snapshot of the Fed’s holdings of domestic securities. First let’s look at those holding as of January 8, 2020:

https://www.newyorkfed.org/markets/soma-holdings

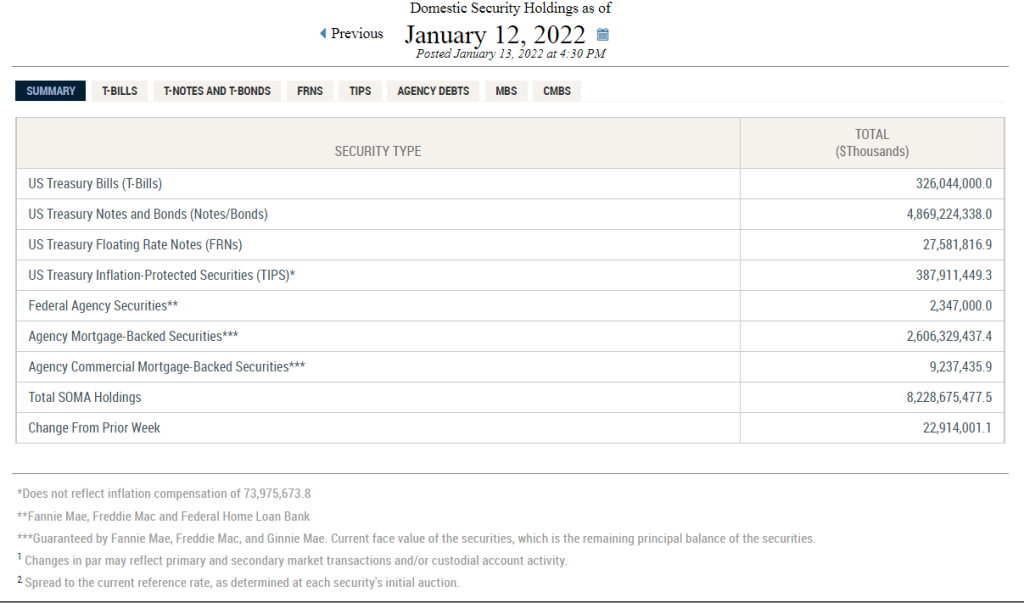
Now look at the latest figures for the same holdings:

https://www.newyorkfed.org/markets/soma-holdings

During this period, total holdings have increased from $3.7 Trillion to $8.2 Trillion. And to give you broader historical perspective, the current amount is about 11x greater than what was reported in January 9, 2008.

Tuesday, January 18, 2022

US Treasuries sell off as markets price in Fed rate rises this year

The 10-year Treasury has been selling off. This is how the yield curve looks like as of January 18th:

An increase in yield means bond prices are falling – hence the term of sell-off when we are talking about fixed income markets.

When we look at the CME FedWatch tool to assess the probabilities of a rate hike this year we can see that this is a foregone conclusion. Take a look at the December 2022 probabilities, which are derived from the Fed Fund Futures contract prices:

We see that there is a 32.8% probability that rates will be within the 1 – 1.25% range; 26.9% within the 1.25 – 1.50% range; and 11.2% within 1.5 – 1.75% range. Adding these probabilities we see that there is approximately 70% chance we will see the Fed Fund rate above 1% by the end of this year (current rate is between 0 - .25%). This tells us that indeed investors are expecting multiple Fed rate rises this year.